

Chester and Patuxent River Report cards released
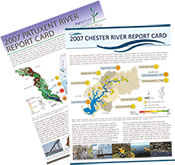 IAN and EcoCheck released the first ever Chester and Patuxent River report cards during April. These report cards are the result of a 12 month project aimed at showing how data collected by community groups and government departments can be combined into a product that engages and informs the local community. The project was supported by a grant from the Chesapeake Bay Trust. The Patuxent River estuary scored a 'D-' grade although grades ranged from 'C-' to 'F', depending on the location. Creeks flowing into the Chester River scored a 'C' grade, while the tidal region scored a 'D'. Additional partners in this project were the Maryland Department of Natural Resources, NOAA Chesapeake Bay Office, Waterkeeper Alliance and Gov4n6.
Regional report card project initiated
 Report cards are increasingly being used by community organizations to assess and communicate the health of their local waterway. IAN/EcoCheck staff are taking the lead in an effort to promote synergies and uniformity among these efforts, with an aim to make report cards widely used and comparable. Staff from a variety of organizations recently met at the Annapolis Synthesis Center to start addressing issues from data analysis through to design and layout of report cards. In addition, IAN/EcoCheck will also produce two new report cards this year, one for the MD Coastal Bays and a second for the Severn River. Organizations involved in the project include: Chesapeake Bay Trust, MD Coastal Bays Program, Patuxent, Severn and West/Rhodes Riverkeepers, and the Chester River, South River and Sassafras River Associations.
Individual tributary report cards produced for the Chester, Patuxent, and Severn Rivers
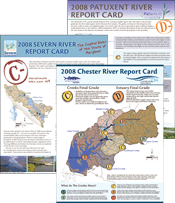 UMCES researchers worked with local Riverkeeper organizations to produce river-specific report cards for the Chester, Patuxent, and Severn Rivers. These reports, funded by the Chesapeake Bay Trust and supplemented by data collected by citizen scientists, are designed to provide the organizations with a new set of tools to better track local ecosystem health of their waterways and report them to their communities. The Chester River estuary received a D, the Patuxent River a D-, and the Severn River a C-.
New partnership to standardize indicators and methods in Chesapeake Bay
 EcoCheck initiated a new effort to develop standards for data collection and analysis by watershed organizations and tidal volunteer monitoring networks. Participants include representatives from the Nanticoke, Choptank, Chester, Sassafras, Magothy, Severn, South, West/Rhode, and St. Mary's Rivers, with additional members expected to join. Currently, each organization collects and reports data for different indicators and in different ways, making comparison between datasets difficult. This new effort tasks the group with identifying a core set of indicators that should be collected, developing standard sampling and analysis methods for those indicators, and establishing common considerations for designing sampling schemes. Guidelines will be produced for other non-profit or volunteer-based groups assessing ecosystem health, and will hopefully lead to a rich and robust data set that can help fill a critical data gap in Bay tributaries.
A Guide to the Mid-Atlantic Tributary Report Cards
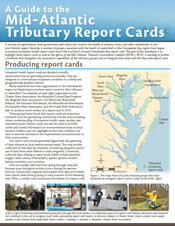 Recently, a number of groups concerned with the health of watersheds in the Chesapeake Bay region have begun to produce ecosystem health report cards much like EcoCheck's annual Chesapeake Bay report card. This newsletter highlights those local report cards as well as the efforts of the Mid-Atlantic Tributary Assessment Coalition (MTAC). MTAC emerged from the effort initiated by EcoCheck to bring members from watershed organizations and tidal monitoring networks together in order to identify core indicators that should be monitored by all groups and to develop standards for data collection, analysis, and reporting. Currently, MTAC participants are working to produce written protocols that will help ensure uniformity of monitoring, sample analysis, and data management that will in turn allow direct comparison of data and report card scores from each region.
Citizens for Science seminar series
 The IAN seminar series has recently expanded into two series: the original 'Science for Citizens', and now a new 'Citizens for Science' series in association with the Mid-Atlantic Tributary Assessment Coalition (MTAC). This new series will focus on monitoring conducted by various citizen science groups in the Mid-Atlantic region. The goal is to use volunteer-collected data to develop eco-health report cards, increase environmental literacy, and empower the public. In the first seminar of the series, Bill Dennison talks about the Challenges and advantages of using citizen scientists for environmental monitoring.
Expanding the diversity of the Mid-Atlantic Tributary Assessment Coalition
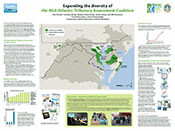 Since the 2006 release of the first EcoCheck Chesapeake Bay report card, environmental report cards have gained increasing popularity and recognition as a public-friendly and scientifically sound method for reporting the health of a waterway. Recently, a number of watershed organizations in the Mid-Atlantic region have begun producing their own tributary-specific report cards. In 2009, the Mid-Atlantic Tributary Assessment Coalition (MTAC) was formed to foster collaboration among watershed organizations and to fully develop the potential of region-specific environmental report cards. This can be accomplished through the standardization of indicators, monitoring and sampling protocols, data analysis methods, and science communication techniques.
Nanticoke and Sassafras River report cards released
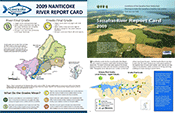 The two final tributary report cards to be released this year are from the Nanticoke and Sassafras Rivers. Both of these report cards are the first ever for their respective rivers, and are designed to look at the overall ecosystem health of their watersheds while also engaging local residents and helping them to better understand their river systems. Both rivers received passing scores, with the Nanticoke River receiving a final grade of B-minus, and the Sassafras River a grade of B. While those scores indicate that most water quality indicators met desired levels, there is still room for improvement. In particular, the Nanticoke scores showed a need for nitrogen reduction, and the Sassafras scores indicate that poor water clarity and high phosphate levels were problems of concern in 2009.
2010 Magothy River Index
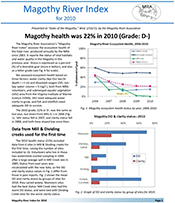 This report card is an assessment of the aquatic health of the Magothy River, and is based on data collected by the Magothy River Associationand various partners. It reports the status of vital habitats and water quality in the Magothy during 2010 based on three different indicators; water clarity (Secchi depth ≥ 1 m), dissolved oxygen (> 5 mg/L), and SAV area. The 2010 health index, 22% (D-), was the same as last year.
Deep Creek Lake Baseline Condition Assessment
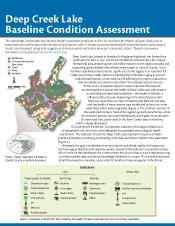 EcoCheck conducted a baseline ecological health assessment for Friends of Deep Creek Lake in preparation for production of future annual lake report cards. A unique assessment framework and preliminary data analysis results are presented, along with suggestions for future work and action items for concerned citizens. A summary of the findings is available in this four-page newsletter, with the complete report available in the full assessment document.
Sampling and Data Analysis Protocols for Mid-Atlantic Tidal Tributary Indicators
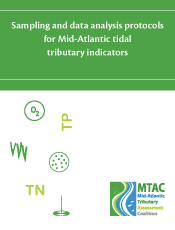 This report provides guidelines for the successful production of tidal ecosystem health report cards. Specifically, it develops clear and consistent protocols for the identification, collection, and analysis of indicators to be used by report card-producing organizations in the mid-Atlantic region.The overall objective of this protocol document is to encourage and enable comparisons of monitoring results from report card-producing organizations and to increase the scientific validity of report cards as outreach tools. It is intended for use in tidal areas only, as the ecosystem health indicators and thresholds discussed are pertinent only to tidal ecosystems.
Total Maximum Daily Loads: A citizen's guide to the Chesapeake Bay TMDL
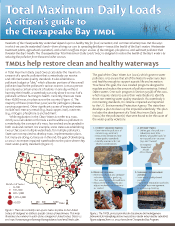 Residents of the Chesapeake Bay watershed depend upon a healthy Bay for food, recreation, and commercial enterprises. But the ways in which we use the watershed's lands—from driving our cars to spreading fertilizers—impact the health of the Bay's waters. Wastewater treatment plants, agricultural operations, and urban runoff are major sources of the nitrogen, phosphorus, and sediment pollution that threaten the Bay's health. The Chesapeake Bay Total Maximum Daily Load (TMDL) is designed to restore the health of the Bay's waters by reducing the pollution from these and other sources.
Bacteria sampling and data analysis protocol
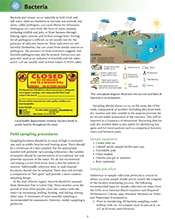 This document develops a clear and consistent protocol for the identification, collection, and analysis of the indicator of bacteria. Specifically, this document serves as an addendum to the Sampling and data analysis protocols for Mid-Atlantic tidal tributary indicators which provides guidelines for the successful production of tidal ecosystem health report cards. The bacteria protocol was written and reviewed by the MTAC group and Ecocheck. This document is intended for use in tidal areas only, as the ecosystem health indicator and thresholds discussed are pertinent only to tidal ecosystems.