

IAN conceptual diagram symbol libraries hit 10,000 downloads
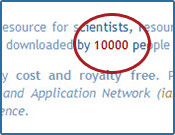 In late June, the IAN symbol libraries reached a milestone of 10,000 downloads, from people in 177 countries and 50 states in the USA. The IAN symbol libraries contain over 1,500 custom made symbols (in 32 categories) designed specifically for enhancing science communication skills through the development of conceptual diagrams. The aim of the libraries is to make them a standard resource for scientists, resource managers, community groups, and environmentalists worldwide. The IAN symbol libraries are available for download completely cost and royalty free.
IAN Symbol Libraries a big hit at the Horn Point Lab Open House
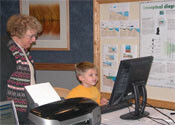 On October 15, the UMCES Horn Point Lab (HPL) Open House was held, with over 700 adults and children exploring the eight science display areas in the Aquaculture and Restoration Ecology Lab building. A touch tank, oyster and fish hatchery tours, field work films, project posters, and sampling equipment provided interesting and interactive opportunities for the public to learn from faculty and students about the activities going on at the laboratory. At the IAN table, conceptual diagram posters were displayed and computers were available for anyone to try their hand at creating a Chesapeake Bay scene using the IAN Symbol Libraries. Young children loved playing with the symbols, while teenagers were excited to see how effective and useful this technique of science communication could be for school projects and reports, and adults considered the potential of conceptual diagrams for business or personal use.
IAN Symbols used in winning poster at MEES Colloquium
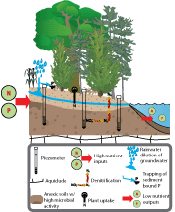 The 2005 Marine Estuarine Environmental Sciences (MEES) graduate program colloquium was held at the Center of Marine Biotechnology in Baltimore on October 7-8, 2005 with a student poster session on the second day. Forty-three posters were judged by a panel of MEES faculty, and Adrienne Sutton of the UMCES Horn Point Lab received the “outstanding” award and a $500 stipend for her poster, describing her research on the impact of restored riparian buffers on nutrient inputs at the watershed scale. Employing IAN’s extensive symbol libraries and science communication techniques, along with some guidance from IAN’s Tim Carruthers, she created conceptual diagrams, illustrating the points of her study. Adrienne says she is “now officially an IAN convert” and enthusiastically encourages others to take advantage of the IAN resources.
Conceptual diagrams used in publication on nutrient dynamics of seagrass meadows.
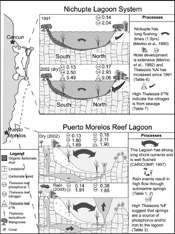 A recent article in Estuarine Coastal and Shelf Science (64: 191-199) by Tim Carruthers, Brigit van Tussenbroek, and Bill Dennison uses conceptual diagrams to synthesize the results of a project carried out in the eastern Yucatan peninsula. The study assessed the tissue nutrients and δ15N of Thalassia testudinum growing in the Nichupte Lagoon adjacent to Cancun, and then adjacent to and distant from submarine vent sites within the Puerto Morelos Lagoon. Greater seagrass tissue nitrogen and a high δ15N ratio indicated that sewage nitrogen was high close to Cancun, whereas seagrass near to submarine vents in the Puerto Morelos Reef Lagoon indicated a greater availability of phosphorus to the seagrass. This paper is an example of how conceptual diagrams created with the IAN symbol libraries can be used to provide graphical representations of system processes in the published literature.
IAN awarded Packard Foundation grant to develop science communication tools
 The Integration and Application Network team recently received Packard Foundation funding for a two-year project to develop science communication tools for three sites within the Packard Foundation's Regional Initiative: Morro Bay (California), the Gulf of California (Mexico), and Palau. These workshops will be used as case studies to develop a handbook for integrated assessment and the project will further expand the conceptual diagram symbol libraries and produce web-based tutorials on using science communication tools. Ultimately, this project aims to use these three geographically and ecologically distinct Packard Foundations Regional Initiative sites to demonstrate the process of integrated assessment as well as develop a library of tools and resources for other locations to perform their own integrated assessments.
Seagrasses of southwest Australia poster series
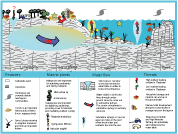
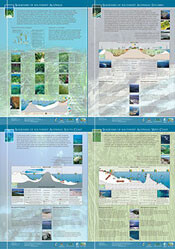 Southwest Australian seagrass meadows are unique and are both regionally and globally significant. This series of four posters (General, Estuaries, South Coast, West Coast) describe the unique coastal systems of southwest Australia through the use of conceptual diagrams from the IAN Symbol Libraries. This project was funded by CoastWest in Australia and the poster series is specifically targeted at the general public to communicate key issues and management priorities of these seagrass habitats. Tracey Saxby, Tim Carruthers, and Bill Dennison from IAN worked with Marion Cambridge (University of Western Australia) and members of the Water and Rivers Commission in Western Australia to put the posters together. The posters will be displayed at boat ramps, local stores, and information centers. They are available (in PDF format) from IAN press.
IAN Symbol Libraries reaches 20,000 downloads in 200+ countries
The IAN conceptual diagram symbol libraries reached a new milestone of 20,000 downloads from people in 202 countries. The IAN symbol libraries contain over 1,500 custom made symbols (in 32 categories) designed specifically for enhancing science communication skills through the development of conceptual diagrams. The aim of the libraries is to make them a standard resource for scientists, resource managers, community groups, and environmentalists worldwide. The IAN symbol libraries are available for download completely cost and royalty free.IAN Image & Video Library
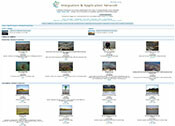 The IAN Image & Video Library now contains over 1000 high resolution images (photos, satellite images, diagrams) and videos for use in science communication. The library is browsable by category and searchable via keywords. Our aim is to make the library the primary image and video resource for scientists, resource managers, community groups, and environmentalists worldwide, so we encourage users to contribute their images and videos to the library. Images and videos are provided completely free for any use–all that is required is an appropriate photographer credit.
ISBW 7 Conference 2006
 On September 10-15, Tim Carruthers from the IAN group attended the seventh International Seagrass Biology Workshop (ISBW7) in Zanzibar, Tanzania. Tim gave a presentation on work being carried out with an NCEAS (National Center for Ecological Analysis and Synthesis) project on Global Seagrass Trajectories, entitled “A Global Crisis for Seagras Ecosystems?”. He also gave a short workshop on techniques in effective science communication.
IAN Image Library now with over 2,000 images
 The IAN Image and Video Library is a searchable database of over 2,000 high-resolution images and other media files. Images are browsable by categories, but are also indexed by title, description, and keywords to make searching easy. Advanced search options include searching by media type (photos, satellite images, vector graphics, maps, animations, videos), orientation (portrait, landscape, panorama), image dimensions/resolution, and age. The library focuses primarily on Chesapeake Bay and surroundings, but we also have images from Alaska to Florida, and as far afield as Australia and Palau. All images are available cost- and royalty-free. You are also encouraged to submit your images for inclusion in the library to help expand this resource.
IAN interns head to graduate schools
 Lucy van Essen-Fishman and Kim Kraeer finished their 10 month IAN internships in May. Both are headed to graduate schools in the fall—Lucy will be traveling to Oxford University, U.K. to study ancient Greek, while Kimmy will be moving to Washington, D.C. to study biology at American University after a summer working as a dolphin trainer at the National Aquarium in Baltimore. The two interns were instrumental in developing and testing the environmental negotiating game "Trade-Off!" and in creating hundreds of new symbols for the IAN symbol library. In addition, they made substantial contributions to the COSEE Coastal Trends website and aided IAN Science Integrators and Science Communicators in a variety of projects throughout their internships. Lucy and Kimmy were wonderful to work with and we wish them great success in graduate school.
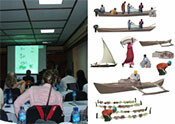
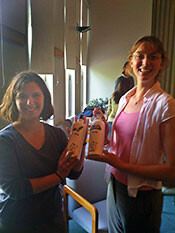
EBM Tools Network webinar on science communication
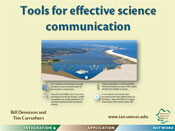 On September 30, Bill Dennison and Tim Carruthers presented a webinar on tools for science communication for the Ecosystem-Based Management Tools Network. Bill was also presenting to a live audience at the State of the Hudson River Watershed Conference in Hyde Park, NY. The web audience included participants from 23 US states and 12 countries, and was followed by a lively discussion on methods and approaches to science communication.
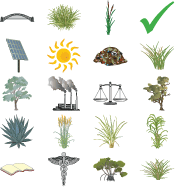
IAN Symbol Libraries reach 2500 symbols
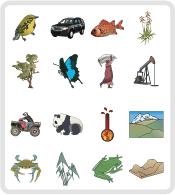 The IAN Symbol Libraries has reached a major milestone with 2500 vector symbols. The site now includes a custom download builder for the SVG, AI, and PNG formats. Users can search or browse through 55 albums of symbols, create a custom lightbox, download only new symbols since their last download, or choose from the most popular symbols. Don't have vector software? Try out our online diagram creator and create conceptual diagrams directly in your web browser, choosing from the entire IAN symbol collection. As always, the libraries are cost and royalty free. For more details, see the release announcement blog post.
100 million symbols downloaded
 Since their first public release in 2003, more than 100 million symbols from the IAN symbol libraries have been downloaded by users from 235 countries. Particularly popular has been the new SVG and PNG (raster) versions, facilitating more users with a variety of software packages to utilize the symbols. In the last 18 months since the release of the online conceptual diagram creator, 11,000 symbols have been used by 1,300 people to create diagrams without the need for specialized vector graphics software.
Australian schools geography curriculum uses the IAN online diagram creator
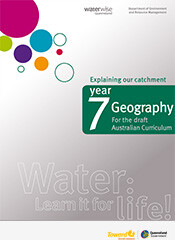 Conceptual diagrams are science communication tools that aim to communicate complex ideas about systems and processes in a simple, visual way. This education resource prepared by the Queensland Department of Environment and Resource Management, through their "Water: Learn it for Life" program, provides teachers with detailed lesson plans to take their students through the story of a river to identify the positive and negative features that most influence the health of the waterway. The lesson culminates in the students producing a conceptual diagram using the IAN Online Diagram Creator.
Interactive symbol creation tutorial
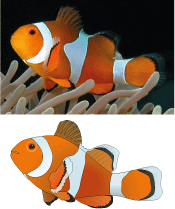 The Integration and Application Network's symbol libraries have been developed over many years by various science communicators. In our attempts to build a global symbol language, we also welcome contributions from anyone with relevant, high quality vector illustrations. To this end, we have developed an interactive tutorial to show you exactly how to trace this clownfish photo in Illustrator. It will introduce you to a variety of techniques that will allow you to develop your own symbols. If you find you lack the artistic flare to create your own symbols, and are in need of something that is not available in our libraries, you can contact us for a quote to have one of our talented science communicators make them for you.
Non-attribution rights to IAN symbols and images now available
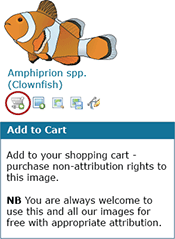 The IAN symbol and image libraries have always been, and always will be, provided completely free for any use as long as the appropriate attribution (credit) is included. However, an increasing number of people have requested to use our images without this credit, either because it detracts from their layout or design, or simply because they want a cleaner, more professional, and branded appearance. Users now have the option to purchase the rights to use our symbols and images without the need for attribution. This means they can be used in company logos, on merchandise for sale, or any other situation where the attribution is not appropriate. This does not in any way affect the ability to use them for free; it simply makes them available for uses that were previously not possible.
9th Pacific Islands Conference on Nature Conservation and Protected Areas
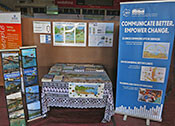 IAN staff attended the 9th Pacific Islands Conference on Nature Conservation and Protected Areas in Fiji in early December, setting up our first IAN conference booth. Our booth proved extremely popular, with almost all of our materials ravaged by the end of the first day! The conference itself was a fantastic opportunity to meet Pacific-based colleagues that we've worked with virtually, and to catch up with others. IAN diagrams and reports were featured in several keynote presentations and workshops throughout the conference, and we've started lining up potential new collaborations for the next few years. The word is getting out!
Workshops are Beautiful: Data visualization in NYC
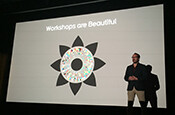 Jane Thomas and Brianne Walsh traveled to New York City to participate in a one-day workshop on data visualization. The workshop was presented by David McCandless, writer, data journalist, designer, and author of the blog and book Information is Beautiful. The workshop outlined four steps of creating effective and dynamic data visualizations: concepting and generating good, interesting ideas, researching and curating juicy data, executing and selecting appropriate and effective visualizations, and designing and beautifying impactful charts and diagrams. The workshop provided a fun, hands-on, insightful introduction and approach to the development of infographics, and IAN hopes to incorporate David's tips and tricks into our own design process.