

Ecosystem health report cards: An approach to integrated assessment
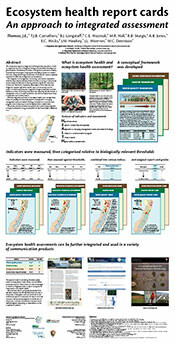 Integrated ecological assessment of the world’s coastal ecosystems is essential for effective management and remediation. The integration of management, monitoring, and science is required to solve the major environmental problems that are occurring in coastal zones around the world. Effective monitoring requires a significant investment of resources. Field work is expensive, data analysis is time-intensive, data integration requires high level scientific input, and recurring costs are subject to inflationary pressures. Integrated ecological assessment provides feedback on these monitoring investments by measuring the effectiveness of management actions. Societal momentum can then be created by successes in assessment and communication. This poster presents processes and approaches to performing integrated ecological assessments, using an example from the Coastal Bays of Maryland.
Report on nitrogen source assessment for Maryland Coastal Bays available
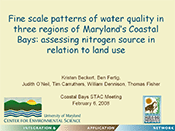
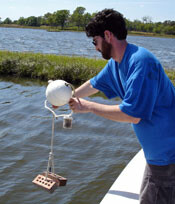 IAN graduate student Ben Fertig assessed nitrogen sources in Maryland's Coastal Bays. Partnering with the Maryland Coastal Bays Program and the Department of Natural Resources, this study focused on four regions—St Martin River, Public Landing, Johnson's Bay, and Chincoteague Island, which were found to be nitrogen 'hotspots' by a 2004 assessment. Two biological indicators, the macroalga Gracilaria and the native oyster Crassostrea virginica, were used to integrate nitrogen over short and long term time periods, respectively. Ben is exploring the potential of these indicators to determine and monitor nutrient sources to augment conventional water quality monitoring. This report details the study's findings.
The role of benthic communities in the health of Maryland's Coastal Bays
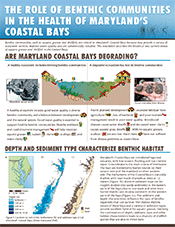 In collaboration with the University of Maryland's Cooperative Extension Service at the Wye Mills Research and Education Center, EcoCheck (NOAA - UMCES partnership) has produced a newsletter on the history and current trends of benthic communities in Maryland's Coastal Bays. Aquatic grasses and shellfish are important components of a healthy ecosystem because they provide a variety of ecosystem services, improve water quality, and are commercially valuable.
Biological indicators enhance water quality monitoring in Maryland's Coastal Bays newsletter
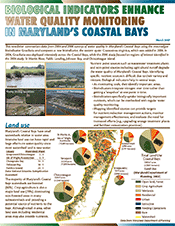 Nutrient point sources such as wastewater treatment plants and non-point sources including agricultural runoff degrade the water quality of Maryland's Coastal Bays through excessive nutrient loading. Identifying specific sources is difficult due to their variety and mixture. Biological indicators can identify nitrogen sources, integrate nitrogen from these sources over time, and detect biologically important nutrients. Mapping identified sources can provide targets for nutrient reduction management actions, monitor management effectiveness, and evaluate the need for increased efforts. This newsletter summarizes data from the 2004 and 2006 water quality surveys of Maryland's Coastal Bays, incorporating the macroalgae Gracilaria sp. and the eastern oyster Crassostrea virginica as bioindicators.
IAN continues its involvement in the Maryland Coastal Bays
 Bill Dennison has taken over as the new chair of the Maryland Coastal Bays Science and Technology Advisory Committee (Coastal Bays STAC), succeeding Dr. Tom Jones of Salisbury University. UMCES graduate students, Kris Beckert and Ben Fertig continue their study and synthesis of Maryland's Coastal Bays. At the recent STAC meeting, they presented summary water quality and oyster bioindicator findings from their 2007 field surveys, and a data report will be available shortly. Jane Thomas presented the latest version of 'Shifting Sands', a synthesis book about the coastal bays.
Newsletter examines effects of land use on water quality in Maryland's Coastal Bays
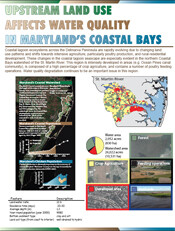 Coastal lagoon ecosystems across the Delmarva Peninsula are rapidly evolving due to changing land use patterns and shifts towards intensive agriculture, particularly poultry production, and intensive rural-residential development. These changes in the coastal lagoon seascape are especially evident in the northern Coastal Bays watershed of St. Martin River. This region is intensely developed in areas such as the Ocean Pines canal community, is composed of a high percentage of crop agriculture, and contains a number of poultry feeding operations. Water quality degradation continues to be an important issue in the watershed. This newsletter examines how upstream land use affects water quality.
Maryland Coastal Bays Report Card
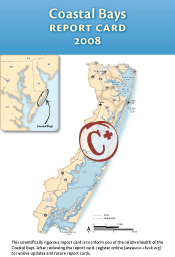 This report card provides a transparent, timely, and geographically detailed assessment of 2008 Coastal Bays’ health. Prepared annually, the report card rates six reporting regions of the Coastal Bays, using six indicators combined into a single overarching index of health. Health is defined as progress towards established scientifically derived ecological thresholds or goals. The overall health of Coastal Bays was moderate in 2008, obtaining a grade of C+. The highest ranked region was Sinepuxent Bay (B), while the lowest ranked regions were Newport Bay and St. Martin River (D+). The report card website enables you to explore the report card in more detail via the regions and indicators.
Maryland Coastal Bays Report Card 2009
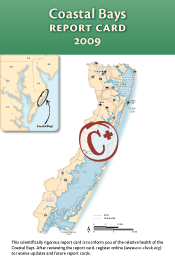 The aim of this report card is to provide a transparent, timely, and geographically detailed assessment of 2009 Coastal Bays health. Coastal Bays health is defined as the progress of four water quality indicators (TN, TP, Chl a, DO) and two biotic indicators (seagrass, hard clams) toward scientifically derived ecological thresholds or goals. The six indicators are combined into one overarching Coastal Bays Health Index, which is presented as the report card score. Detailed methods are available at https://ecoreportcard.org/report-cards/maryland-coastal-bays/health/. The overall score for the Coastal Bays was a C+ in 2009. While the northern bays and western tributaries continue to struggle, there are signs of improvement in some areas. However, the southern bays—historically the more pristine of the Coastal Bays—are showing signs of degradation.
Characterization and Comparison of Stream Nutrients, Land Use, and Loading Patterns in Maryland Coastal Bay Watersheds
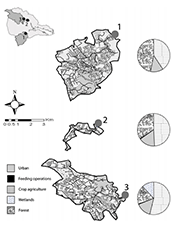 This paper, published in Water, Air, & Soil Pollution 221(1-4): 255–273, discusses land use and its relation to nutrient concentrations and loading via streams in the Maryland Coastal Bays. The most significant correlation was with the land area of feeding operations. A similar relationship was also found with anthropogenic land area (cropland + urban + feeding operations). Wetland area was positively associated with hydric soils. Watersheds with the most crop agriculture had the highest nitrogen export coefficients, while the highest phosphorus export was in a watershed containing a non-operational chicken hatchery. This suggests that agricultural development, especially animal feeding operations, and landscape characteristics are important factors to understand nutrient loading.
2010 Maryland Coastal Bays report card
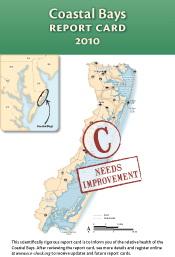 The aim of this report card is to provide a transparent, timely, and geographically detailed assessment of 2010 Coastal Bays health. Coastal Bays health is defined as the progress of four water quality indicators (TN, TP, Chl a, DO) and two biotic indicators (seagrass, hard clams) toward scientifically derived ecological thresholds or goals. The six indicators are combined into one overarching Coastal Bays Health Index, which is presented as the report card score. Detailed methods are available at https://ecoreportcard.org/report-cards/maryland-coastal-bays/health/. The overall score for the Coastal Bays was a C in 2010. All regions declined in overall health when compared to 2009.
Coastal Bays Report Card 2011
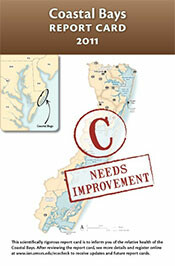 The aim of this report card is to provide a transparent, timely, and geographically detailed assessment of 2011 Coastal Bays health. Coastal Bays health is defined as the progress of four water quality indicators (total nitrogen, total phoshorus, Chlorophyll a, dissolved oxygen) and two biotic indicators (seagrass, hard clams) toward scientifically derived ecological thresholds or goals. The six indicators are combined into one overarching Coastal Bays Health Index, which is presented as the report card score. Detailed methods and results are available on the EcoCheck Coastal Bays report card website. The overall score for the Coastal Bays was a C in 2011, with little change since 2010.
Maryland Coastal Bays report card 2012
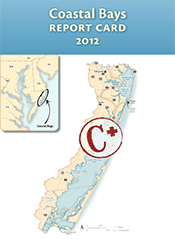 The aim of this report card is to provide a transparent, timely, and geographically detailed assessment of 2012 Coastal Bays health. Coastal Bays health is defined as the progress of four water quality indicators (total nitrogen, total phosphorus, chlorophyll a, dissolved oxygen) and two biotic indicators (seagrass, hard clams) toward scientifically derived ecological thresholds or goals. These six indicators are combined into one overarching Coastal Bays Health Index, which is presented as the report card score. Detailed methods and results are available on the EcoCheck Coastal Bays report card website. The overall score for the Coastal Bays was a C+ in 2012, with a slight improvement since 2011.
Maryland Coastal Bays report card 2013
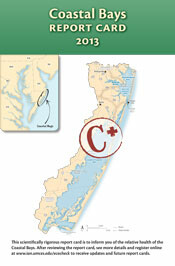 The aim of this report card is to provide a transparent, timely, and geographically detailed assessment of 2013 Coastal Bays health. Coastal Bays health is defined as the progress of four water quality indicators (total nitrogen, total phosphorus, chlorophyll a, dissolved oxygen) and two biotic indicators (seagrass, hard clams) toward scientifically derived ecological thresholds or goals. These six indicators are combined into one overarching Coastal Bays Health Index, which is presented as the report card score. Detailed methods and results are available on the EcoCheck Coastal Bays report card website. The overall score for the Coastal Bays was a C+ in 2013, with a slight improvement since 2012.
IAN in 2015
 The Integration and Application Network has an exciting 2015 ahead. IAN has undergone a staffing expansion, with five new staff based at the Chesapeake Bay Program, a new administrative staff position, and two PhD students beginning in January 2015. A concerted teaching effort by IAN is being launched in 2015, with full semester courses in Science for Environmental Management (Spring 2015) and Communicating Science Effectively (Autumn) being offered. In addition to our ongoing Chesapeake Bay and Maryland Coastal Bays projects, we are looking forward to exciting projects in New York (Long Island Sound report card and New York Harbor School - Billion Oyster Project), India (with the National Centre for Sustainable Coastal Management) and Australia (Charles Darwin University and Great Barrier Reef Foundation). We have a great set of partners that we will be working with this year on a diverse suite of projects.
Our Path Forward: The Comprehensive Conservation & Management Plan for Maryland Coastal Bays (2015-2025)
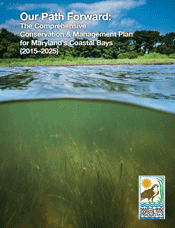 Our Path Forward represents a revision to the 1999 Comprehensive Conservation & Management Plan for the Coastal Bays of Maryland. The work is the culmination of three years (2012-2014) of technical investigation and community involvement to protect the future of the Coastal Bays.
Maryland Coastal Bays Report Card 2014
 The aim of this report card is to provide a transparent, timely, and geographically detailed assessment of Coastal Bays' health in 2014. Coastal Bays health is defined as the progress of four water quality indicators (total nitrogen, total phosphorus, chlorophyll a, dissolved oxygen) and two biotic indicators (seagrass, hard clams) toward scientifically derived ecological thresholds or goals. These six indicators are combined into one overarching Coastal Bays Health Index, which is presented as the report card score. The overall score for the Coastal Bays was a C+ in 2014, a very similar score to last year.
2015 Maryland Coastal Bays report card and website launched
 On September 8, the 2015 Coastal Bays Report Card and accompanying website were launched with an event at the Ocean City Marlin Club. Produced in collaboration with our partners at the Maryland Coastal Bays Program, Maryland Department of Natural Resources, Assateague Island National Seashore, and the Virginia Institute of Marine Science, the aim of this report card is to provide a transparent, timely, and geographically detailed assessment of 2015 Coastal Bays health. The overall score for the Coastal Bays was a C+ in 2015, a very similar score to the previous year.
State of the Maryland Coastal Bays booklet released
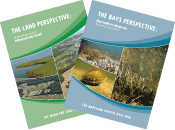 At the same event where the 2015 Coastal Bays Report Card was launched, IAN released the Maryland Coastal Bays 2016: Land and bay perspectives report. Produced in collaboration with our partners at the Maryland Coastal Bays Program, Maryland Department of Natural Resources, and Assateague Island National Seashore, this booklet provides an overview of the current science and management issues in the Maryland Coastal Bays and their watersheds in 2016. It includes two 'booklets' in one publication--one intended for those interested in the bay perspective, and the other for those interested in the land perspective. The two documents culminate in a summary centerfold which focuses on both watershed and bay issues.
IAN receives Gold Star Partnership Award
 IAN received a Gold Star Partnership Award from the Maryland Coastal Bays Program (MCBP) at their annual end-of-year event in Ocean City, MD. IAN was recognized for their contribution in building credibility with both scientists and stakeholders, synthesizing data, communicating results, and developing solutions to environmental problems. In addition, IAN chairs and hosts the Scientific and Technical Advisory Committee of the MCBP. At the same meeting, IAN and MCBP released the 2016 Coastal Bays report card, with both hard copies and the updated Coastal Bays report card website. The grades were slightly improved in the northern embayments, but continued to degrade in the southern embayments.
Maryland Coastal Bays Report Card 2017 released
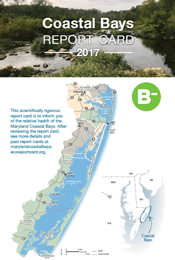 The release of the Maryland Coastal Bays Report Card in Ocean City in September brought some good news. It was the first time that the overall score achieved a B- score, largely due to improvements in Chincoteague Bay nitrogen and phosphorus scores. This was the tenth annual report card produced for the Maryland Coastal Bays. Further improvements will depend on how well we deal with the 'triple threat' of 1) agricultural runoff, 2) Chincoteague Island septic runoff, and 3) entrainment of offshore Ocean City sewage discharge.
Maryland Coastal Bays Report Card Released
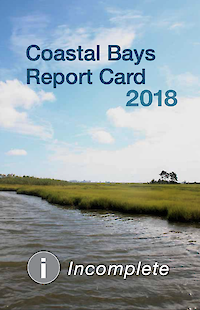
Ocean City, MD, USA. Bill Dennison and Heath Kelsey presented the 2018 Coastal Bays Report Card on Monday, September 23, at the Marlin Club in West Ocean City, Maryland. Data for two of the six indicators were unavailable for the 2018 Report Card, which meant that the Coastal Bays received an Incomplete this year. Water quality results declined from 2017, because of very high rainfall, which was the third highest on record, and increased nutrient input to Coastal Bays. The problems in collecting seagrass data also illustrate the challenges of monitoring under climate change influences. Seagrass information is collected by aerial imagery, which requires specific conditions that were hampered by increased cloud cover.
2018 Maryland Coastal Bays Report Card
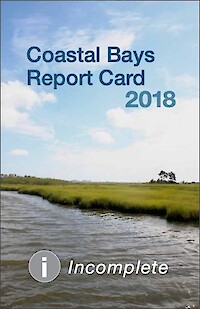
We produced the annual Maryland Coastal Bays Report Card with our partners at the Maryland Coastal Bays Program. The Bays received an Incomplete score for 2018 due to a lack of data.
Maryland Coastal Bays Report Card published
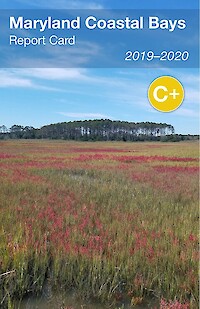
The MD Coastal Bays Report Card was released in Ocean City, MD on October 13, 2021. The aim of this report card is to provide a transparent, timely, and geographically detailed assessment of 2019–2020 Coastal Bays health. Coastal Bays health is defined as the progress of four water quality indicators (total nitrogen, total phosphorus, chlorophyll a, dissolved oxygen) and two biotic indicators (seagrass, hard clams) toward scientifically derived ecological thresholds or goals. The six indicators are combined into one overarching Coastal Bays Health Index, which is presented as the report card score. The overall score for the Coastal Bays was a C+ for the 2019-2020 reporting cycle. This was a decrease from the last full year of data in 2017.
Coastal Bays classroom maps make their debut
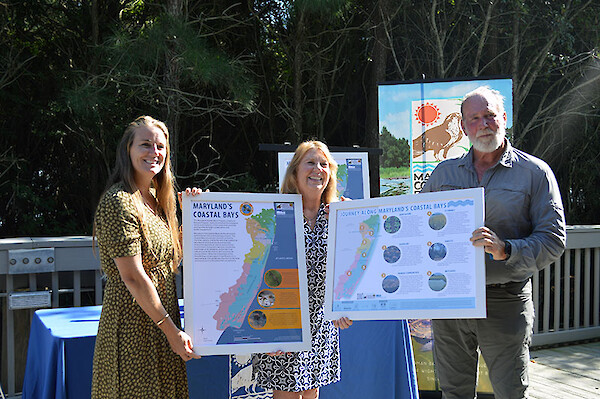
IAN developed a watershed map with the Maryland Coastal Bays Program that will be put up in classrooms in Worcester County. The map posters aim to educate students about the local and environmental value of the Coastal Bays, instilling a sense of ownership and familiarity with the watershed. The two-sided classroom map posters will also be available in libraries and other community centers.
2023 Maryland Coastal Bays Report Card Release
The 2023 Maryland Coastal Bays Report Card is now available! The release event was held in Ocean City, attended by scientists and managers as well as citizens and volunteers. Heath Kelsey and Annie Carew represented IAN at the event. The report card score is a B-, which is the highest score that the Coastal Bays have ever received. This increase was driven by improvements in the seagrass and hard clam scores, but there is still a lot of room for improvement. Congratulations to the Maryland Coastal Bays Program for another successful year!
2024 Maryland Coastal Bays Report Card Release Event

The 2024 Maryland Coastal Bays Report Card was released on December 11, 2025 in Ocean City, Maryland. The Coastal Bays received their highest-ever grade this year, a B! There were large increases in seagrass coverage in Newport Bay and Sinepuxent Bay, which is exciting news. The event was well-attended by Maryland Coastal Bays Program volunteers, staff scientists, and collaborators. Heath Kelsey and Annie Carew represented IAN and celebrated with our partners at the Maryland Coastal Bays Program and Department of Natural Resources.