

Inorganic Nitrogen in Chesapeake Bay Watershed Diagram
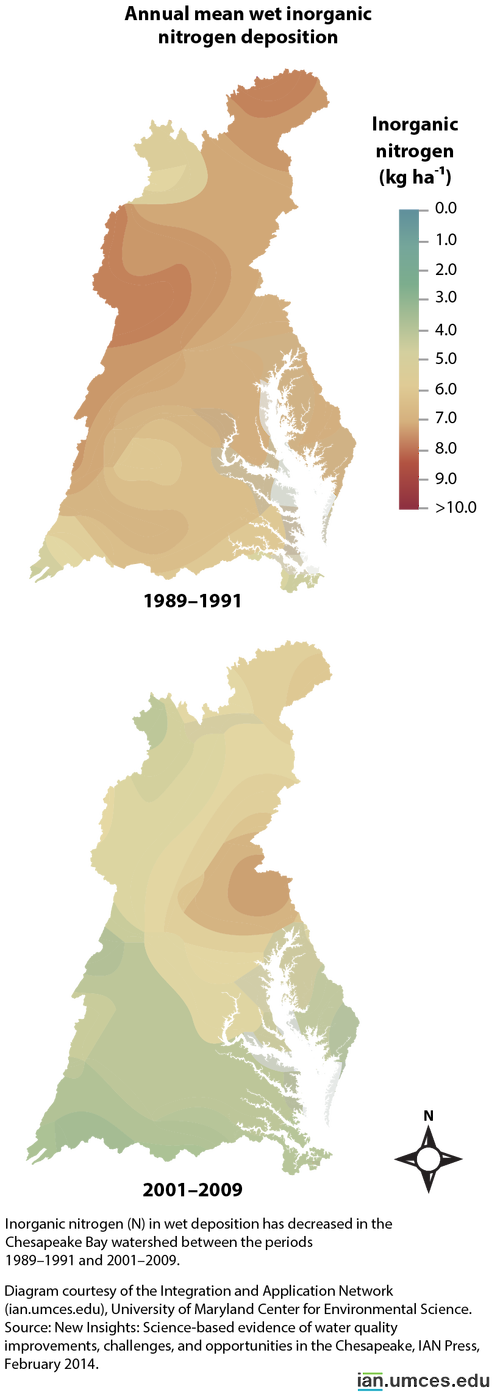
A diagram showing that inorganic nitrogen (N) in wet deposition has decreased in the Chesapeake Bay watershed between the periods 1989–1991 and 2001–2009.
Nitrogen Chesapeake Bay wet deposition New Insights| Property | Value |
|---|---|
| Author(s) | Brianne Walsh, Christina Lyerly, Liza Hernandez, Bill Dennison |
| Author Company | Integration and Application Network |
| Date Created | 2014-02-24 |
| Album | Processes > Chemical |
| Type | Graphic |
| Publication | New Insights: Science-based evidence of water quality improvements, challenges, and opportunities in the Chesapeake |
| Dimensions | 820 x 2296 |
| Filesize | 221.2 kB |
| Number of Downloads | 323 |
| Filetype(s) | PNG |
| License | Attribution-ShareAlike 4.0 International (CC BY-SA 4.0) |
| Required Attribution | Brianne Walsh, Christina Lyerly, Liza Hernandez, Bill Dennison, Integration and Application Network (ian.umces.edu/media-library) |