UMCES HOME
DONATE
COVID-19
Search form
Search
Work with Us
Science communication services
Environmental report card production
Training and capacity building
Stakeholder Engagement
Careers
Publications
Books
Report Cards
Newsletters
Reports
Brochures
Posters
Papers
Media Library
Symbols
Graphics
Photos
Videos
Report cards
Education
Professional Certificate
MEES Graduate Program
Short Courses
Initiatives
Blog
Enewsletter
Projects
About
Who we are
What we do
Our Mission
History
Partnerships
Contact
Land Acknowledgment Statement
Project Videos
Home
Media Library
Search Term
Album
Any
Ecosystems > Coastal/Marine
Ecosystems > Desert
Ecosystems > Elements
Ecosystems > Freshwater
Ecosystems > Grassland
Ecosystems > Maps
Ecosystems > Meteorology/Climate
Ecosystems > Mountains/Tundra
Ecosystems > Other
Fauna > Amphibians
Fauna > Birds
Fauna > Cnidaria
Fauna > Crustaceans
Fauna > Echinoderms
Fauna > Fish
Fauna > Insects/Arachnids
Fauna > Mammals
Fauna > Molluscs
Fauna > Other
Fauna > Protozoans
Fauna > Reptiles
Fauna > Worms
Flora > Fungi/Lichen/Moss
Flora > Grasses/Herbaceous Plants
Flora > Macroalgae
Flora > Mangroves
Flora > Marsh/Wetlands
Flora > Microalgae
Flora > Seagrass/SAV
Flora > Trees/Shrubs/Vines
Human > Agriculture
Human > Aquaculture
Human > Climate Change
Human > Culture/Archaeology
Human > Development/Infrastructure
Human > Education
Human > Environmental Degradation
Human > Fishing
Human > Forestry
Human > Management/Restoration
Human > Manufacturing/Refining
Human > Mapping/Navigation
Human > Mining
Human > Other
Human > Recreation
Human > Science/Research
Human > Services
Human > Transport
Processes > Biological
Processes > Chemical
Processes > Inputs/flows
Processes > Modifiers
Processes > Physical
Prokaryotes and Viruses > Bacteria/cyanobacteria/archaea
Prokaryotes and Viruses > Viruses
Media Type
Any
Symbol
Graphic
Photo
Video
Vector or Raster
Either
Raster
Vector
Sort Order
↓ Date
↓ Num. of Downloads
↓ Name
↑ Date
↑ Num. of Downloads
↑ Name
Apply Filters
Clear Filters
Lightbox (
0
)
Symbol Package
Chenopodium oahuense (Aweoweo)
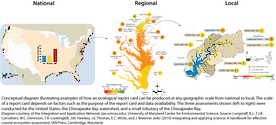
Division of regions in ecological report cards
Geographic scaling of report cards
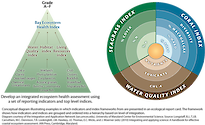
Integrating data into an ecological report card
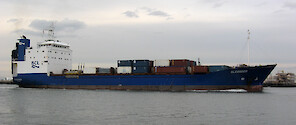
The Oleander
Triaenodon obesus (Whitetip Reef Shark)
Petroglyph: (Hawaiian Honu)
Rachel Carson
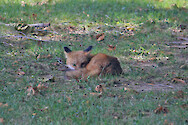
Red fox
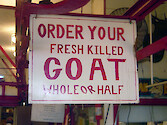
Meat market
Shells on a beach
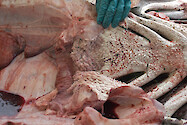
Pharynx and esophagus of Basking Shark
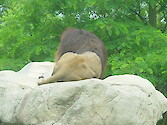
Lion
Core logger
Tecticornia flabelliformis (Bead Samphire)
Mustela frenata (Long-tailed Weasel)
Mustela nigripes (Black-footed Ferret)
Neovison vison (American Mink)
Vulpes velox (Swift Fox)
Vulpes vulpes (Red Fox)
Lobelia cardinalis (Cardinal Flower)
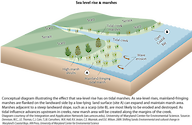
Sea-level rise & marshes
Caretta caretta (Loggerhead Turtle) : hatchling
Freight: freight train
Prev
1
…
3
4
5
6
7
8
9
10
11
12
…
17
Next