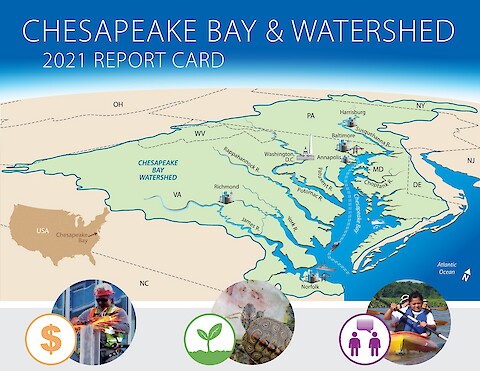
2021 Chesapeake Bay and Watershed Report Card
This report card provides a transparent, timely, and geographically detailed assessment of Chesapeake Bay and its Watershed. Since 2016, UMCES has engaged stakeholders throughout the watershed to transform the report card into an evaluation of the Chesapeake Watershed health. Watershed health includes traditional ecological indicators, but also economic and societal indicators. This is the third year the watershed has been scored, and four new economic indicators have been added. Linkages and relationships between the ecological, economic, and societal indicators will be evaluated in future report cards.
Overall, the Chesapeake Watershed scored 56%, a C+. There were three ecological indicators, four economic indicators, and four societal indicators.
Overall, Chesapeake Bay scored 50%, a C in 2021, which improved slightly since 2020. Long-term trends are still showing improvement for the overall Bay and four other regions, while one region is showing a declining trend.
Keywords: Chesapeake Bay, Chesapeake Bay Watershed, Bay Health, Watershed Health, Aquatic, Terrestrial, Societal, Report Card, environment, ecosystem, walkability, heat vulnerability index, social index, protected lands, stewardship, benthic community, water quality, economics, median household income, housing affordability, income inequality, jobs growth, ecological, societal, economic