

What is the big picture – Identifying Values and Threats
| Environmental Report Cards | Science Communication | 1 commentsIn the last class, we learned that the first step in developing a report card was to engage stakeholders to help define and visually describe the basin that could lead to a shared understanding of the current situation within a particular basin. The goals of this were the following:
- Define the values within the basin that are to be protected and/or restore
- Define the threats that are causing degradation to those values or impeding their restoration.
A couple of activities of how this can be achieved that we explained during the class were: SNAP Values and Threats and Stakeholder mapping.
1. SNAP!
The class was asked to identify the features (ecological, social, and/or economic) that they consider to be of value to their own basins. These were written on note pads and placed on the white board. We were also asked to identify the threats to the identified values. These were also written on note pads and placed on the white bored. The values and threats were grouped according to their similarities. These grouped values and threats were then ranked in order of priority through voting by members of the class.
-
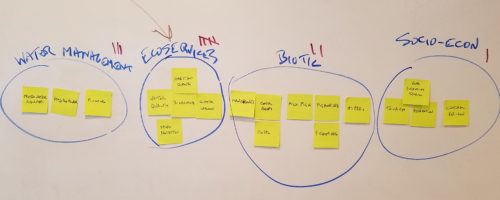
The Values of their respective basin identified by the class. Photo Credit: Vanessa Vargas-Nguyen
We learned that SNAP is an interactive process for developing a conceptual model of the basin. Here each participant, provided with three sticky notes (preferably green), are required to write what they value about the basin in 1-2 words (i.e., each participant comes up with three values). Then everyone is asked to come to a wall where a facilitated game of “Snap!” begins. Someone starts by sticking one of their values on the wall, the other participants that have the same values say “Snap!”, read out their value, and place it on top of the original value. Once that value is exhausted, a second one begins the process until no one has a sticky note left. At the end of this process there will be numerous clusters of values on the wall. The same activity is conducted for the threats (preferably red sticky notes) to the basin which also results in clusters of threats.
-
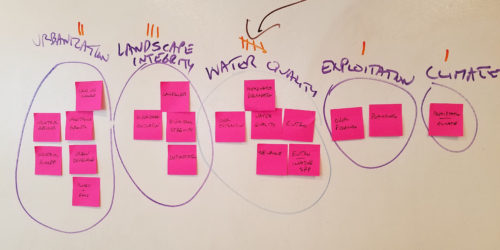
The Threats to their respective basin identified by the class. Photo Credit: Vanessa Vargas-Nguyen
We learned that SNAP! enables input from every participant and is a relatively quick way to get the process achieved. We also learned that, what is often found is that some values and threats are posted that other participants may not have previously considered. So it is important to transcribe the clusters of values and threats into lists (preferably also on the wall/white-board), so that participants can vote on the values/threats they feel are most important. This can be achieved by giving every participant sticky dots, for example, that can be use for voting. There are certain circumstances where public voting may be a little uncomfortable for certain participants due to cultural, political, or contentious understandings. In these situations it is possible to employ an anonymous voting and graphing system so that participants can nominate values and threats (and indicators).
2. Stakeholder Mapping
Indicators and corresponding thresholds resulting from this interactive process are strongly dictated by the participants engaged in the activity. Therefore, a balanced choice of stakeholders at the workshop is necessary. One tool that can help with characterizing and prioritizing stakeholders is stakeholder mapping. In our class activity, we were asked to identify stakeholders relevant to our basin. The identified stakeholder group were then placed in a matrix of low to high influence and low to high interest in the basin report card.
We also learned that stakeholder mapping can be used to identify stakeholders that should be further engaged to create interest or empower depending on their current positions on the map. Leaders that can help in creating interest and empowering other stakeholder can also be identified using this approach.
-
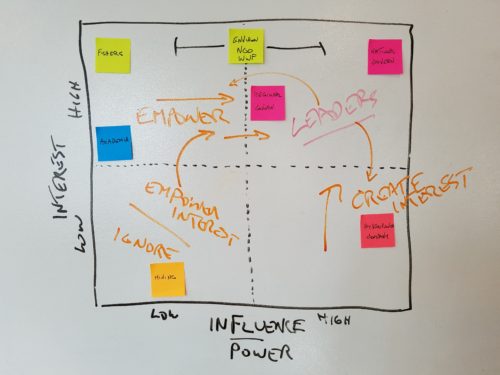
The stakeholder map that was created during the class. Photo credit: Vanessa Vargas-Nguyen
3. Word Cloud
Another simple activity that was mentioned in class was the creation of word clouds. A word cloud is a visual representation of text data which shows the importance of a word (or idea) typically through the font size and/or, in some cases, the font color. We were asked to nominate three words that best describes their basin. These words collectively were used to create a word cloud using a web-based word-cloud generator. Using this activity, key attributes and/or features of a basin that are most important are identified.
-
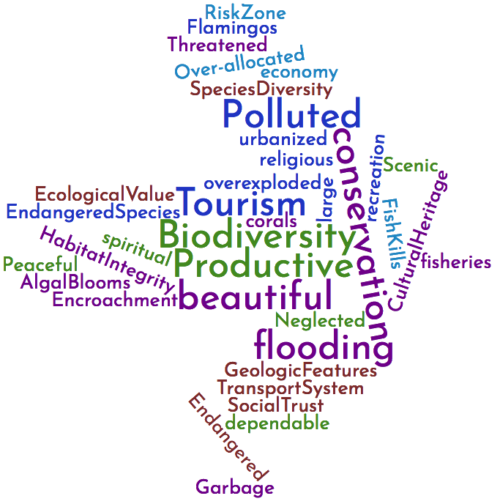
The word cloud generated using keywords given by the class to describe their basin. Credit: Vanessa Vargas-Nguyen using wordclouds.com
All three of these activities can help stakeholders in developing a common understanding and shared visioning of their basin. For a successful report card development, it is important that before moving on to the next steps, there is reflection as a group on whether all relevant environmental, social, and economic concerns were addressed and represented during the Conceptualization step.
Next Post > An Array and a Ray
Comments
-
Ricardo Merlos 7 years ago
Quite a dynamic class session. These activities worked very well as an "icebreaker" and motivated the classroom to participate. Related to this blog I recommend to read "Stakeholder workshop tips" page 26 of the Practitioner's Guide.