

Bringing Communities Together Through Water: The Start of Socio-Environmental Report Cards for the Southeast Michigan region
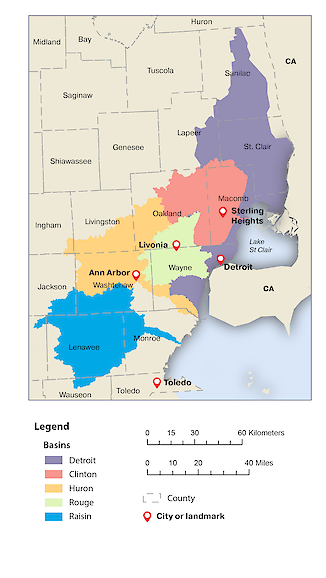
Lorena Villanueva-Almanza · | Environmental Report Cards |The last of three virtual workshop sessions for the development of individual and regional socio-environmental report cards for the Detroit, Clinton, Huron, Rouge, and Raisin rivers in Michigan concluded on November 16, 2021. The main goal of these sessions was to work with stakeholders to identify indicators that reflect the social, cultural, economic and environmental values of the Southeast Michigan region.
Day 1, November 4
Our first workshop started off with Heath welcoming 57 attendees from all five watersheds and introducing executive directors Marie McCormick from the Friends of the Rouge, Stephen May, from the River Raisin Watershed Council, Rebecca Esselman from the Huron River Watershed Council, Eric Diesing, ecologist with the Clinton River Watershed Council (Anne Braise, is their Executive Director), Tricia Blicharski from Friends of the Detroit River, and Jamie Konopacky and Amanda Herzog from the Fred A. and Barbara M. Erb Family Foundation, who funded this 2-year project.
For many of us, this was the first time we met, but for our colleagues, Dylan Tallie, Heath Kelsey, and George Chmael II, from our partner organization Council Fire, LLC the virtual workshop was an opportunity to reconnect with watershed directors, whom they’d visited in Michigan in October. You can read about their trip in our newsletter.
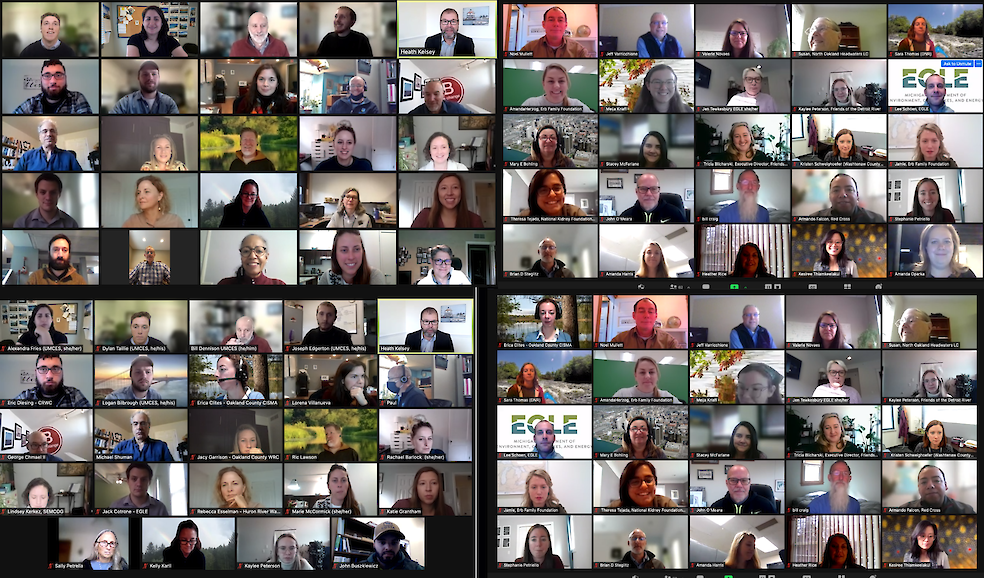
Attendees of the report card workshop
Bill Dennison gave an overview of the report card process highlighting the importance of having scientific data to build stewardship in the region. You can watch some of the videos detailing how report cards are created in this IAN’s Youtube playlist.
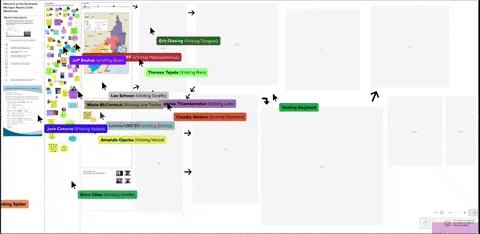
Following introductions, we had a brief rundown on the use of Mural, an online whiteboard where participants shared with us what they value most about their watershed. Next, we asked everyone to identify these values as either environmental, economic, or social/cultural using a Venn Diagram. Colorful stickies flew around the white board. Using the same format, we asked for them to share what they consider to be the most important threats to their watershed. As one of the participants mentioned, for each of these values, there is a lurking threat.
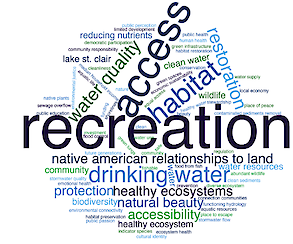
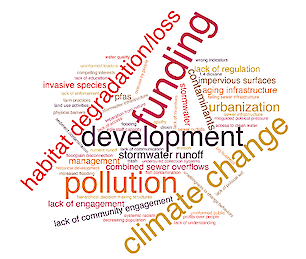
Word clouds, which Joe Edgerton generated, were a great way to visualize the outcome of the discussions on values and threats—the first step in the report card process. While recreation and access are among the most important values, lack of funding, climate change, and pollution are the biggest threats to the region. Several participants also mentioned apathy and lack of engagement as main threats, echoing Sir David Attenborough who said that “no one will protect what they don't care about; and no one will care about what they have never experienced.”
We also wanted to learn which threats participants thought would be easier to manage and there is good news: Improving water quality and combating pollution were perceived as both being easier to solve and having the greatest impact for their communities. In stark contrast, and unsurprisingly, participants identified climate change as one of the hardest challenges.
From the breakout sessions, it was evident that each watershed is unique. For example, water flow response in the Clinton River is different depending on what part of the river you are at. For those in the lower part it’s like “putting a fire hose on the side of the drains every time it rains,” explained Jeffrey Bednar, an Environmental Resources Manager at Macomb County Public Works. Meanwhile, a navigable river that still has some debris to provide habitat for local fauna was a concern raised in the Raisin River watershed discussion.
Among the commonalities, we learned that the Huron is not the only river used as a source of drinking water. The Clinton, Detroit, and Raisin also provide water for people to drink in the surrounding communities—something that even surprised some of the participants.
For homework, Heath asked participants to use the whiteboard to share key historical, cultural, and geographical features of each watershed so that we can develop an environmental literacy statement for the region. The other part of the homework was asking Michiganders to describe how they’d use the report card to improve the conditions of their watershed.
Day 2, November 10
“Do you know what the crookedest river in the world is?”, asked Dylan at the start of the second day of our workshop. This was the first of the ice-breaker questions he asked with Mentimeter, an interactive poll system. In case you haven’t googled it yet, River Raisin is the answer.
Attendees then joined small group discussions that focused on identifying indicators, elements that need to be measured to understand the health of the rivers. As Bill put it, indicators are very much like the lights on a car’s dashboard signaling what’s going on under the hood, or in the watersheds, in this case.
Next, we asked participants to share their take on indicators across the whole region by classifying them as either social, environmental, or economic. Both during whole-group discussions and river break-out sessions, participants mentioned CSOs, SSOs, and PFAS as some of the main threats and indicators. As a plant biologist, I was unfamiliar with these terms, but the frequency with which they came up during our conversations, signaled the problematic regularity with which these communities experience combined sewer overflows, sanitary sewer overflows, and encounter per- and poly- fluoroalkyl substances in their rivers.
As homework, Heath asked us all to take a look at the Mural board. This is where I learned that a careful look at the Rouge River can take you back 14,500 years, to a time where the retreat of glaciers carved the surface of this watershed.
Day 3, November 16
For the last session of this workshop, we started off by reviewing values, threats, and indicators for each watershed. Something that I hadn’t been aware of until this moment was the palpable sense of place that water gives these communities. People have developed deep connections to the river, as Sally Petrella, a monitoring manager with Friends of the Rouge, mentioned during the recap. Accessibility and equity was a common element in all of them.
Michael H. Schumann, from Council Fire, LLC, gave a presentation about economic indicators and the economic health of the region, highlighting the importance of local businesses, like the popular Zingerman’s deli in Ann Arbor.
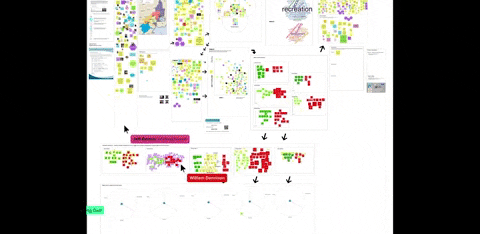
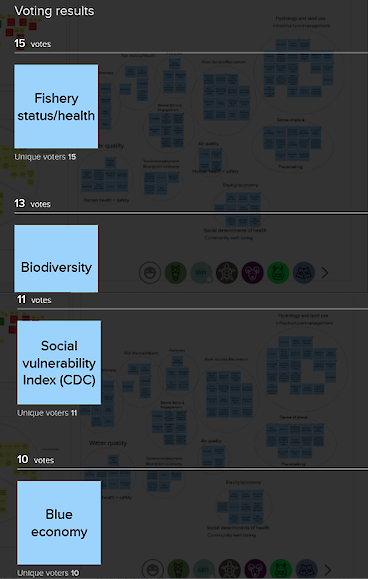
Heath then asked attendees to group the indicators into categories as part of a swarming activity. This exercise revealed groups like fisheries, fish/habitat or fish health, equity/economy, tourism/employment-blue green economy, stewardship and engagement, and water quality. Next, everyone voted for the most important indicators in each category. You can see part of the results in the figure below. During the next part of the project, we’ll be reaching out to executive directors of each of the watersheds to have individual discussions about these categories.
We followed up with a survey on the effectiveness of the workshop facilitation and were happy to hear that participants enjoyed using the online whiteboard. Even when it would be fantastic to personally meet participants, the virtual setting offered some advantages, including avoiding the first snowstorm! Also, traveling still represents challenges during these COVID times so by meeting on zoom we were able to be in Michigan even if virtually. The sessions were recorded and therefore those who missed the workshop can catch up on discussions.
The time spent with Michiganders over the course of this workshop opened my eyes to the problems and opportunities of living in a river watershed. Coming from Mexico City, where most people have lost their connection to the rivers that once ran through the city, and where flood events have become an increasing challenge to the infrastructure, it’s always interesting to me to see how people elsewhere deal with similar challenges and care about their rivers.
Funding for this project comes from the Fred A. and Barbara M. Erb Family Foundation, whose mission is to advance “an environmentally healthy and culturally vibrant metropolitan Detroit and a flourishing Great Lakes ecosystem.”
Photo credits:
Photos and images were provided by UMCES-IAN.
References:
Bobrowsky, P. T., & Fakundiny, R. H. (2002). Geoenvironmental mapping: methods, theory and practice
About the author
Lorena Villanueva-Almanza
Lorena earned her PhD in Botany and Plant Sciences from the University of California Riverside, her MSc in Biodiversity and Taxonomy of Plants from the University of Edinburgh, and her BSc in Biology from the National Autonomous University of Mexico. She has done research on the taxonomy, biogeography, population genetics, and ecology of the iconic palms of the genus Washingtonia. Before joining IAN, Lorena was a AAAS Mass Media fellow and academic editor for Botany One, a digital publication about plant research. She was also a volunteer for the U.S. Botanical Garden running discovery carts and a freelance science writer for outlets in the U.S. and Mexico and She lives in Washington D.C. and enjoys discovering running trails around Rock Creek Park.