

Building an online presence in a day
Alexandra Gibbs ·
It's time to wrap up a semester and what an unusual semester it was. From having a class with Bill Denison while he teaches at 1 am while he's in Australia to a global pandemic that showed us how important having an online presence really is.
If you missed all of our class blogs this semester it is time for a crash course in science communication. With the end result being your own website. No special equipment needed! The most important piece of information to start your science communication journey is to know your audience! Is your website going to be for future employers, the general public, your peers, etc. Keep your audience in mind at every step.
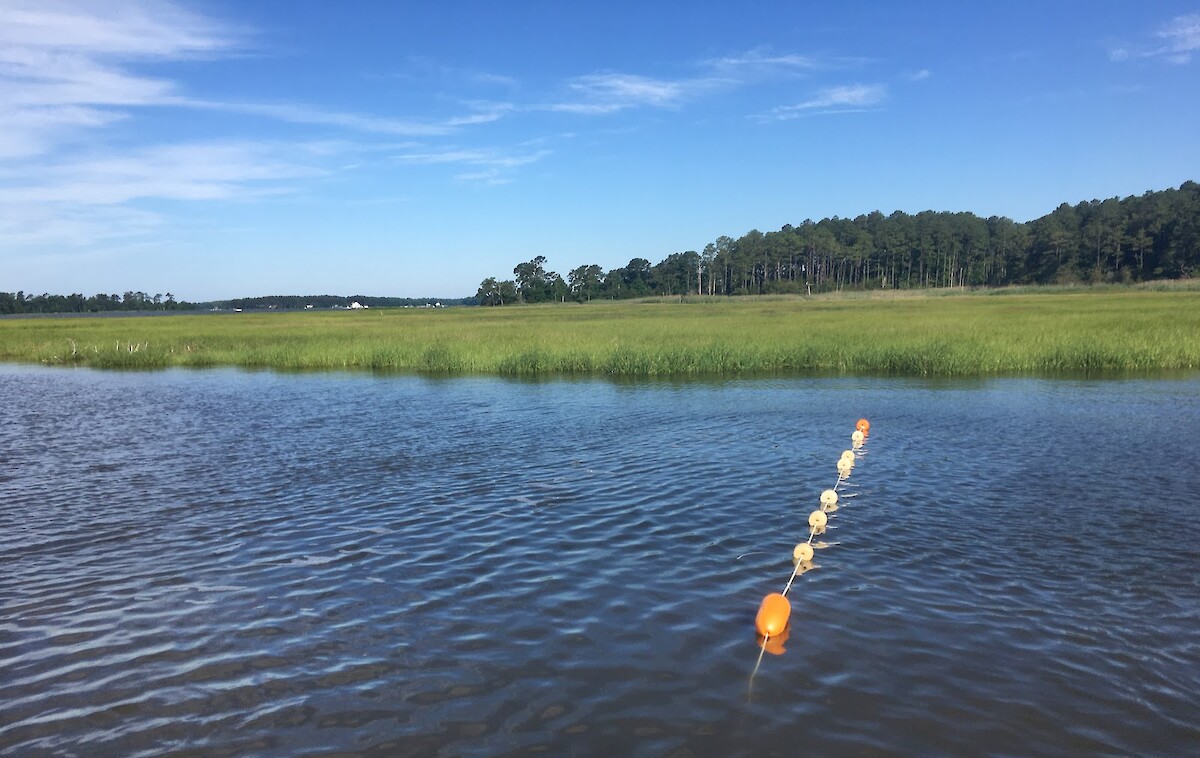
The first thing you will need is a camera. It doesn't matter if it is an iPhone 8 or a $2000 Nikon. Just get out there! When you are taking pictures do not forget these three important rules: Remove distractions. Follow leading lines and horizon lines. Shoot with intent. And take a picture of yourself! People want to know who is doing the research.
We all know one of the most important things to a scientist is data. We spend hours getting just one data point. Now it is time to show it off! Data visualization programs that we used in this class (both completely free) were Tableau and Info.gram. Both have their pros and cons so play around and see what works best for your data. These programs create beautiful interactive data and can be incorporated into a website.
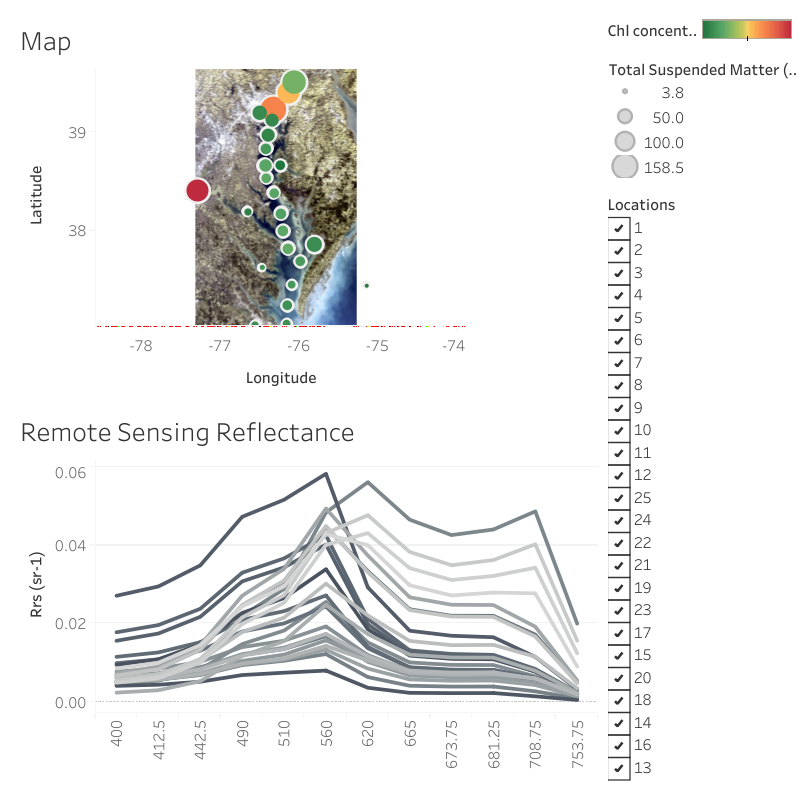
Figure 2. Anna Windle using Tableau to communicate both spatial and quantitative data
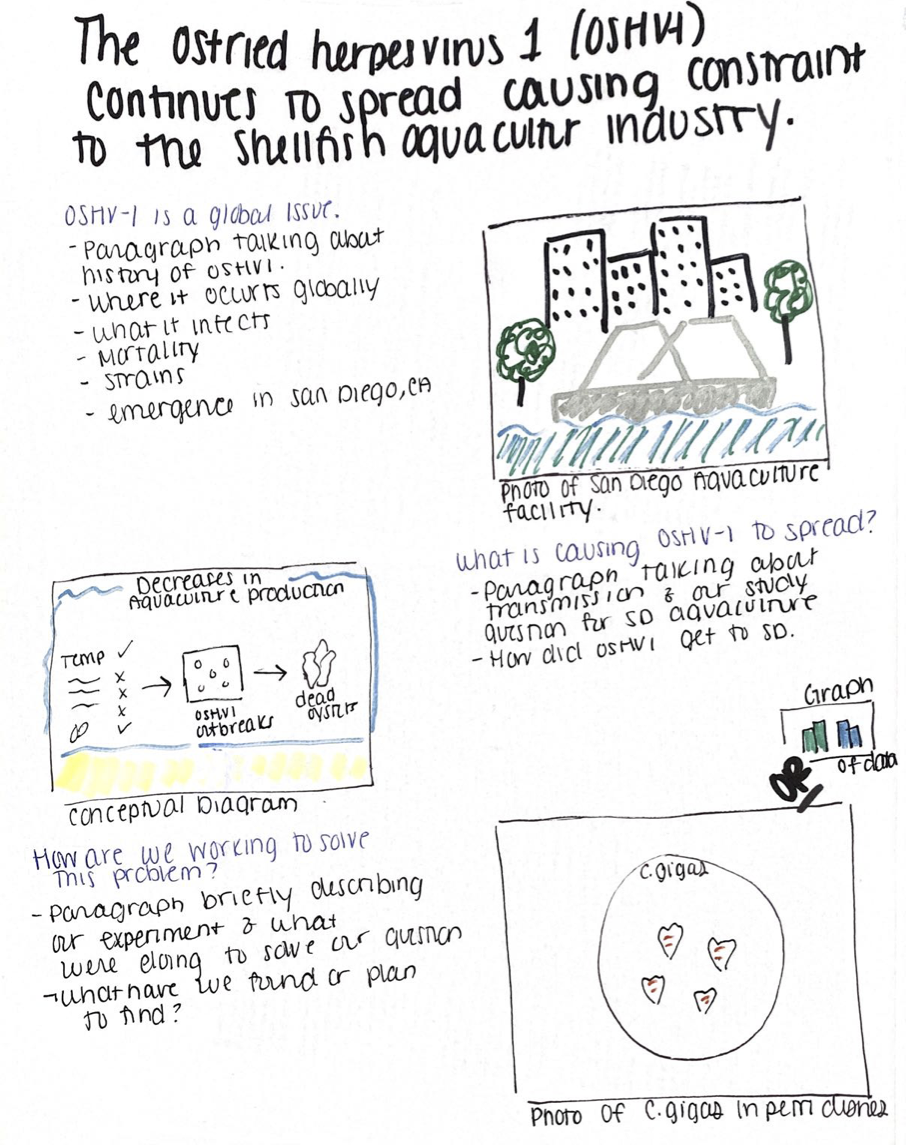
Before creating your website (or scientific poster or newsletter, etc.) creating a storyboard will allow you to visualize your ideas and make changes before you put in the time to create your final product. A storyboard board can be a physical drawing, on a whiteboard, or if computers are your thing, digital. Just get "pen to paper" and plot out your idea. Before you start your final product, show your storyboard to someone that doesn't know your project to see if the general idea is communicated and if you need to make changes.
It is time to pull it all together. Creating a website does not have to be intimidating. You can start one in an afternoon. You have your pictures, you have your data and you have your storyboard. You can do it! Websites like Squarespace, Wix, and Wordpress all provide several simple websites layouts that you can customize as much as you want all for free! Look at your storyboard and the options that each website provides to determine what is best for you. In the one-day crash course, we are going to stick with creating a home page, a research page, and an about page. On your homepage, you will want a few pictures of your research/sample sies and a few blurbs about the project. Your research page is going to include the data visualizations that you created, links to papers that you have published, and may include a "get involved" link if your research includes citizen science. Your about page should have a picture of you/your research team, short bios, and contact information.

Figure 4. Alana Todd's website to convey her research for an audience of her peers/future employers
Now that you have your website, keep it updated! Blog! Connect your Twitter feed! Post pictures of your research!