Coastal Yucatán Report Card Completed!
Heath Kelsey · 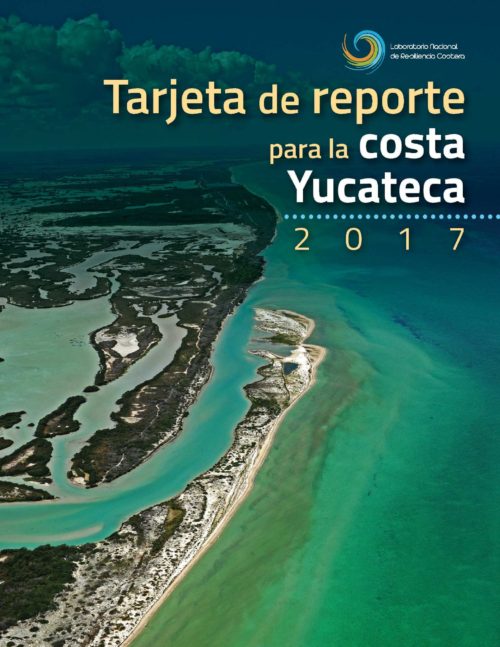
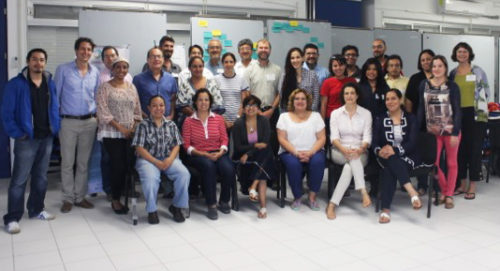
The first Yucatán Coast Report Card was released in April 2018, the culmination of almost 2 years of work by our colleagues at Laboratorio Nacional de Resiliencia Costera (LANRESC), in Sisal, Yucatán Mexico. The project kicked off with a stakeholder workshop that Jane Hawkey and I helped facilitate in August 2016. The long-term collaboration has made this report card release especially exciting. We first got involved with this project through a meeting in Tabasco earlier that year, where I had been discussing the idea of report cards for the Gulf Coast of Mexico. I met Paulo Salles from LANRESC at this meeting and we began talking about a report card for the Yucatán coast with both Paulo and Irina Ize Lema.
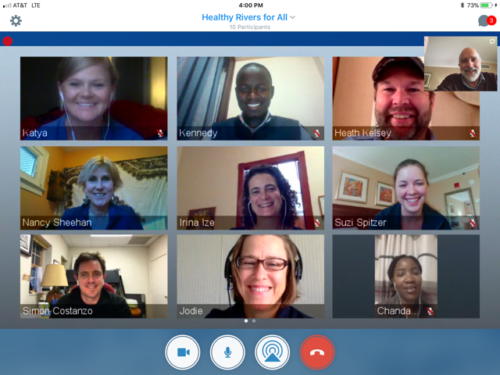
This Report Card project was one of the first to use an approach where IAN helped train practitioners on the report card process, largely leaving them to do the work, but providing support as needed from the IAN team through feedback on drafts and graphics, process questions, etc. Irina was the driving force of the report card project, persistently advancing it through the two-year process. She took our Healthy Rivers for All report card course in Fall 2017, which I think was valuable in helping her make the final push needed to get the project over the finish line. I was happy too, because we were able to keep up with the project as it neared completion.
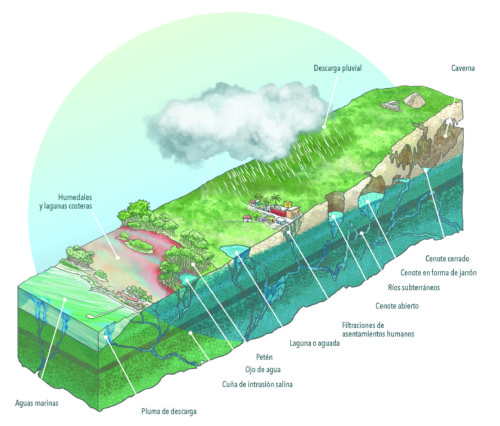
The Yucatán Coast Report Card was really well done; it’s a beautiful document that clearly communicates the relevant issues and results in a simple way, using a good combination of high quality, artistic visual elements. For example, the conceptual diagram of groundwater connections to the surface and coast on Page 2 is exceptional.
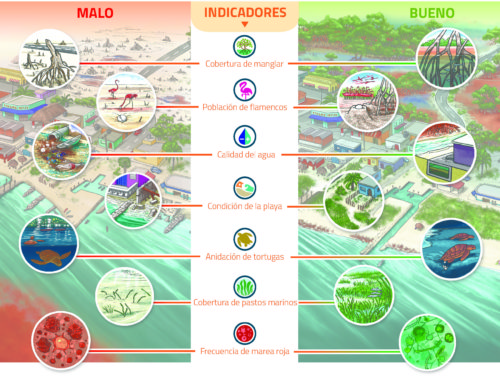
I also really liked the graphical representation of indicators, with an illustration of what it would like to have very poor and very good status. These are both examples that we may begin emulating here at IAN.
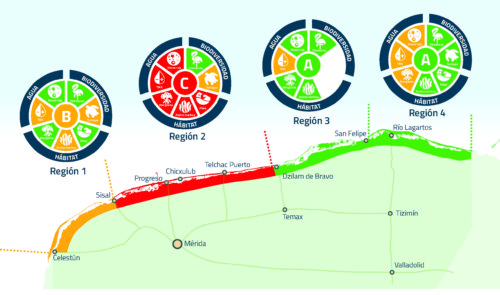
Results from the report card are presented very clearly, with simple explanations about the condition of the coast.
All in all, this report card is one of my favorites – good people, a great location, and wonderful science communication.
About the author
Heath Kelsey

Heath Kelsey has been with IAN since 2009, as a Science Integrator, Program Manager, and as Director since 2019. His work focuses on helping communities become more engaged in socio-environmental decision making. He has over 15-years of experience in stakeholder engagement, environmental and public health assessment, indicator development, and science communication. He has led numerous ecosystem health and socio-environmental health report card projects globally, in Australia, India, the South Pacific, Africa, and throughout the US. Dr. Kelsey received his MSPH (2000) and PhD (2006) from The University of South Carolina Arnold School of Public Health. He is a graduate of St Mary’s College of Maryland (1988), and was a Peace Corps Volunteer in Papua New Guinea from 1995-1998.