Cooks River virtual workshop
Bill Dennison ·
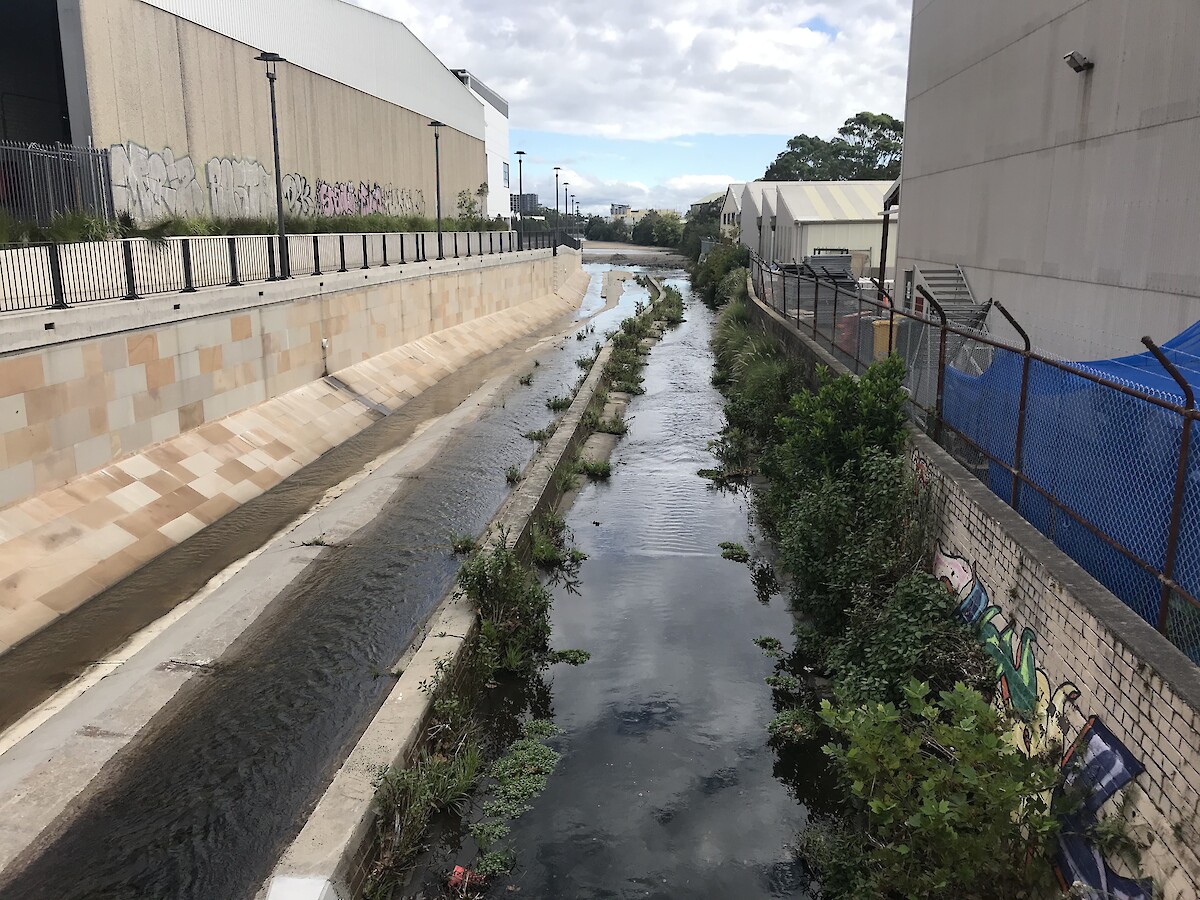
Cooks River is a small, highly urbanized river in Sydney, Australia that flows into Botany Bay near Sydney International Airport. Cooks River Alliance has been monitoring since 2011 and producing annual water quality report cards since 2013-2014, but the folks managing Cooks River are interested in expanding the report card into a socio-environmental report card to integrate social, economic and environmental indicators. Sue Burton and Tom Sinclair from the Cooks River Alliance reached out to us to help guide them on their journey to a socio-environmental report card.
Simon Costanzo and I had agreed to facilitate a one day workshop as part of a two day "Cooks River Catchment Congress: Indicators for a healthy waterway and catchment". But the COVID-19 situation required us to convert the entire Congress to a virtual event. Our format was a set of 4 weekly Zoom calls for 90 min each, with short homework assignments in between each Zoom call.
Our Day 1 workshop (31 Mar 2020) started off with an acknowledgment to country, a brief background to the workshop format and then an excellent virtual tour of the Cooks River catchment. Sue Burton conducted the virtual tour using images, video clips and maps, and the tour included elements of Cooks River history, geography, economy, society, ecology, and variability. Fortuitously, on a visit to Sydney a couple of weeks prior to the Congress, I did a short self-guided driving tour of the river and catchment, so it was great to be able to put my observations into a broader context with Sue's virtual tour. Following the virtual tour, I gave a brief overview of the history and evolution of report cards, which included the reasons to do report cards and how report cards sit atop the environmental intelligence pyramid. Simon then provided an overview of the report card development process and the report card theory of change.

Popular bikeways along Cooks River. Photo: Bill Dennison
We utilized Mentimeter as a way to solicit input and create interactions for workshop attendees, since we had over 40 participants. As an introduction to Mentimeter, we asked everyone to submit their names, where they worked and, just for fun, their favorite color. We learned that green was the overwhelming favorite color, appropriate given the nature of the environmental mission. Mentimeter generated a word cloud for ways to describe the Cooks River catchment, with 'urbanised', 'diverse', 'loved', 'complex', 'degraded' and 'potential' coming out as the most popular words. Another Mentimeter question was to ask participants to rank their perceived interest and influence regarding the health of Cooks River. It was gratifying to see that interest was invariably ranked highly, but the perception of influence was more variable. For homework, we assigned a chapter of "Practitioners Guide to Developing River Basin Report Cards" and sent out a Survey Monkey to prioritize the metrics generated by Mentimeter.

Our Day 2 workshop (7 Apr 2020) started off with a brief summary of Day 1, and we found that we had a sizable number of new attendees as well as the returning people. Simon provided an overview of choosing indicators and thresholds, using the human health model first and then transitioning to stream health. The Cooks River Alliance had commissioned a 'Cooks River Vision and Values Scoping Study,' which provided a nice prioritized list of values that we grouped into 3 categories: 1) Environmental, 2) Social-Cultural, and 3) Economic. We focused initially on the environmental indicators, a) Clean water, b) Biodiversity and ecosystem integrity, and c) Naturalness. Using Mentimeter, we generated word clouds for each indicator, which allowed us to set up a Survey Monkey for participants to vote on their favorite metric as homework for the following week. The other homework assignment was to begin to develop a short list of the key things that people needed to know about Cooks River, so that we could develop a Cooks River environmental literacy statement.
During the interval that we allowed for people to enter their Mentimeter responses, Simon played some Kenny G music which elicited some strong positive and (mostly) negative responses by participants. To deal with this controversy, the Survey Monkey homework allowed for suggested playlists for future Mentimeter intervals.

Our Day 3 workshop (14 Apr 2020) started off with a brief summary of Day 1 & Day 2, and the initial Mentimeter was a quiz that Simon created about whether or not I had a) worked in Antarctica, b) lived underwater or c) climbed Mt. Everest. (The most popular vote was a, but b was the correct answer). We used Mentimeter to generate word clouds for the Social-Cultural indicators a) Aboriginal, heritage and cultural, b) Socialisation and participation, and c) Amenity, accessibility, recreation and safety. We also generated word clouds for Economic indicators for a) Trade, tourism and commerce, b) Land value, c) Stormwater drainage and flood resilience. We also discussed the Cooks River environmental literacy principles and assigned homework to rank the metrics.
Our Day 4 workshop (21 Apr 2020) once again started off with a brief summary of progress to date, and then we summarized the top indicators for each category that were chosen. The fun Mentimeter ice-breaker was to select the image that was from the Cooks River. During the interpretation of the Survey Monkey results, Simon created a new economic indicator for 'Science and education' and we generated a word cloud for this indicator. Another question that we posed to the group was to answer the question "How do you define flood resilience in the Cooks River catchment?" For this question, we programmed Mentimeter to collect short answers, rather than a voting-type survey. We concluded the session with a discussion of next steps, and Sue and Tom from the Cooks River Alliance provided a timeline for completion of the social-environmental report card, which is scheduled for completion in April 2021.
We followed up after the 4 sessions with a survey of the effectiveness of the workshop facilitation. We were gratified to learn that the participants were appreciative of our efforts to create interactive sessions. While it would have been nice to meet everyone in person, there were several advantages of conducting the workshops virtually. 1) Each session was recorded, providing opportunities for people who missed the workshops and offering an archive for future reference. 2) The chat sessions were active during the Zoom sessions, which also provided a nice archive of weblinks and other comments by participants. 3) Stretching the workshop over a 4 week period provided opportunities to solicit input and deliberate more fully. 4) Participants who couldn't attend each workshop were able to be keep up and participate fully. In the future, some combination of in person and virtual workshops might be the way to capture the positive features of both styles of workshops.
About the author
Bill Dennison

Dr. Bill Dennison is a Professor of Marine Science and Vice President for Science Application at the University of Maryland Center for Environmental Science.