Developing a report card for the Integration and Application Network
Bill Dennison · | Science Communication |We have embarked on a journey to create a monitoring and evaluation approach for the Tina Bishop and Peter Tuddenham from the College of Exploration are serving as our external evaluators and Jamie Testa is tasked with the job of being an internal evaluator to support this effort. We have long considered developing an evaluation program for IAN to accompany our efforts, but it has not eventuated until now. Part of the problem is that our funding through grants and contracts is largely for producing various products, but not for evaluating its or our effectiveness. But we have given ourselves an internal deadline of producing an evaluation plan and our first evaluation at the end of 2016.
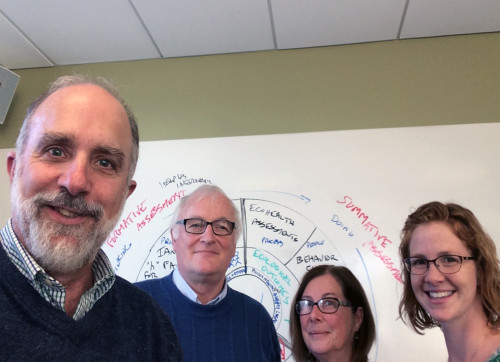
In our initial discussions with Tina and Peter, they asked a simple question: “Why don’t you just do a report card on IAN?”— and this question led to an epiphany for me. We have gone all over the world working with different partners to create report cards, using the five-step process of: 1) conceptualizing the report card, 2) choosing indicators, 3) determining thresholds, 4) calculating scores and 5) communicating results. Using this five-step process on ourselves allowed me to see how we could prioritize indicators and create a workable evaluation program.
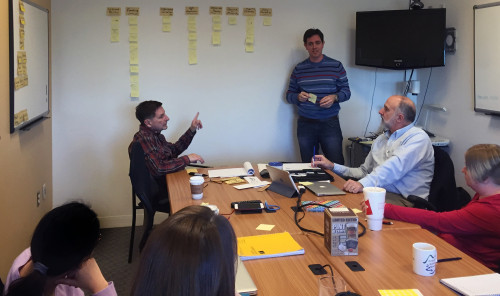
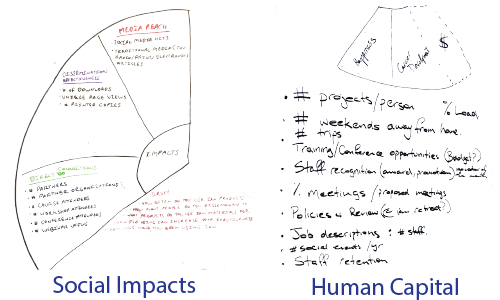
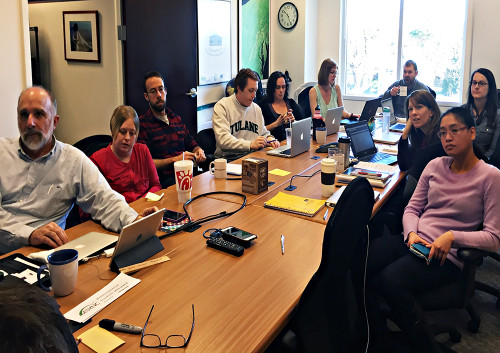
Jamie and I met with Tina and Peter to sketch out a timeline and develop a prototype IAN report card. This gave us the impetus to call an IAN workshop to tackle step 1, conceptualizing the report card. We held this workshop on Groundhog Day (2 Feb 2016) in Annapolis and developed our first draft on what an IAN report card could look like. We created three major categories of indicators: (1) financial and human capital, (2) social impacts and (3) ecological assessments. Each of these three categories has 3 indicators, which will be discussed below.
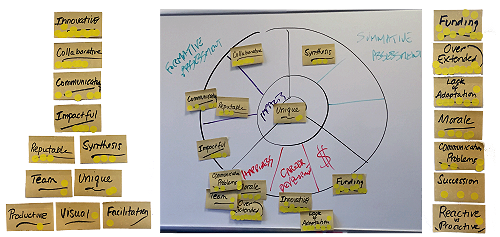
Financial and human capital. This category of indicators addresses the need for IAN to be financial viable in a soft money situation and addresses the need for talented, hardworking and capable staff. An indicator for financial viability, developed by our IAN administrative support staff, will include the net year-end balance of income vs. expenditures, diversity of funding sources, and total funding levels. A ‘Happiness Index’ indicator is envisioned to include things like staff recognition, promotion opportunities, social events, travel, and project management. A career development indicator is envisioned to include training opportunities, conference and workshop participation, and job descriptions vs. responsibilities.
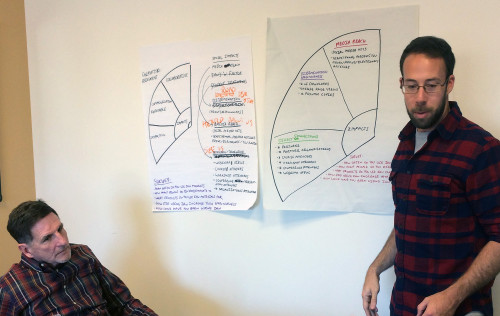
Social impacts. This category of indicators addresses the ability of IAN to be a ‘change agent’ by influencing people, both directly and indirectly. An indicator for the number of direct connections that IAN makes with individuals and organizations at workshops, conferences, and meetings will be developed. IAN staff regularly interacts with hundreds of people from a diversity of organizations and we propose to track these interactions. Another indicator is for dissemination effectiveness. This indicator is proposed to be analogous to the ‘h index’ for peer review scientific publications in which the productivity and citation impact is assessed. IAN produces a diversity of science communication products, many of which are found on IAN Press, and the dissemination effectiveness index could focus on number of downloads, print copies distributed, and citations. A media reach indicator is envisioned which would assess the number and variety of media reports through print, electronic and social media outlets that IAN products or people are mentioned.
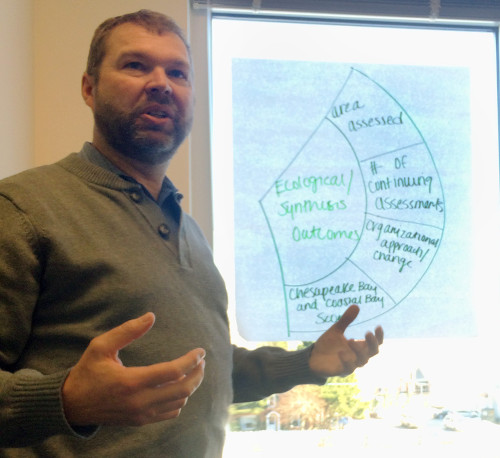
Ecological assessments. This category of indicators includes measures of how much of the planet is being assessed using IAN protocols and for two regions that IAN is intimately involved in assessing, Chesapeake Bay and Maryland Coastal Bays, how well these areas are doing. An indicator could be the quantitative area being assessed using IAN protocols, including the various report cards and integrated assessments that IAN is responsible for conducting. Another indicator could be the areas in which continuing assessments are occurring, allowing for tracking and supporting adaptive management. The indicator that is the most ambitious is the tracking of Chesapeake Bay and Maryland Coastal Bays health. While IAN is intimately involved with the assessment of these regions, many other factors influence restoration progress. Yet, much of what IAN does to support the science and management of these regions should eventually be reflected in improving ecosystem health of these regions.
Our next step will be to develop a checklist for use in IAN projects so that we begin collecting the needed data for this report card. We will also need to tackle the task of determining thresholds for each indicator. The focus on this report card structure is on the quantitative metrics that we can use, but further development of the IAN report card will also need to take into account various qualitative measures as well. We are off to a good start, but like all report cards that we are involved with, we recognize that it will be a long arduous process before the final report card is released.
About the author
Bill Dennison

Dr. Bill Dennison is a Professor of Marine Science and Vice President for Science Application at the University of Maryland Center for Environmental Science.