Discussing island drought in Puerto Rico Part II
Bill Dennison · | Science Communication |I briefly summarized the workshop by highlighting the components of scale that were discussed in relation to island drought: spatial scale, temporal scale and complexity scale. In terms of spatial scale, we had discussions of global influences on island drought: El Niño/Southern Oscillation, North Atlantic Oscillation and Sahara dust storms. On a Caribbean scale, we saw drought maps where drought was manifested in varying degrees on the Greater and Lesser Antilles, Central and South America. On an island scale, we saw drought maps that depicted variable drought within and between islands. In terms of temporal scale, the drought frequency and intensity is important, with island data records stretching back for decades. The sequence of drought interspersed with extreme events like hurricanes is also important for developing adaptation strategies to drought. In terms of complexity scale, drought infrastructure is crucial for obtaining and providing safe water to drought affected communities. Drought awareness is also important for dealing with drought, which is particularly important for large water consumers like farmers. The human dimensions bring about complexity and these drought issues call for more social science to address issues involving people’s perceptions and behavior.

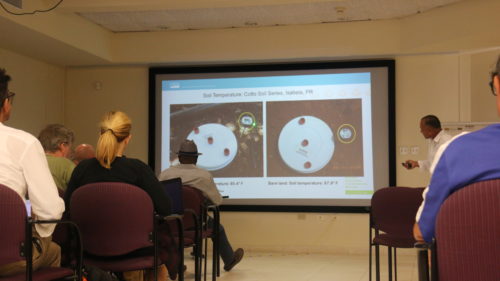
It was clear that the islands suffer from resource limitations for drought science, particularly following the devastating 2017 hurricanes Irma and Maria. Coincidentally, while we were having the drought workshop, a report was released that calculated the loss of human life on Puerto Rico associated with Hurricane Maria, which was over 4,000. There are several strategies to deal with limited resources that can be employed. More collaboration to leverage resources, innovation to develop more efficient data capture and processing and the use of citizen science to obtain data can all help in situations such as these. In terms of data priorities, the importance of starting monitoring NOW, developing early warning systems, improving data processing, creating robust databases and portals with quality assurance/quality control in place and working to translate and disseminate data effectively are all relevant.

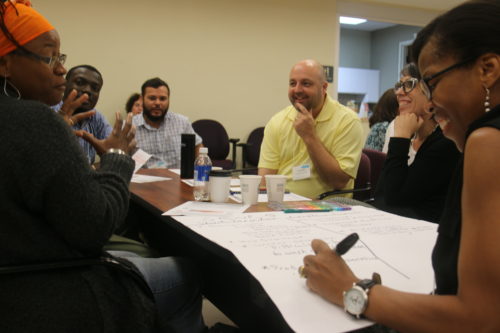
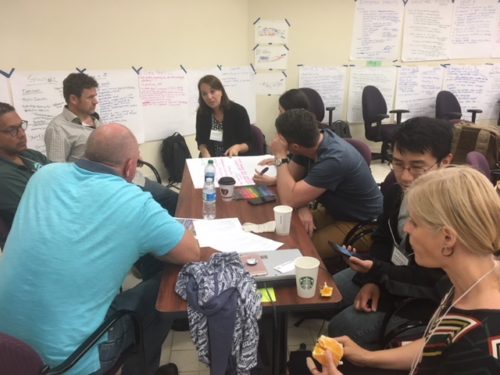
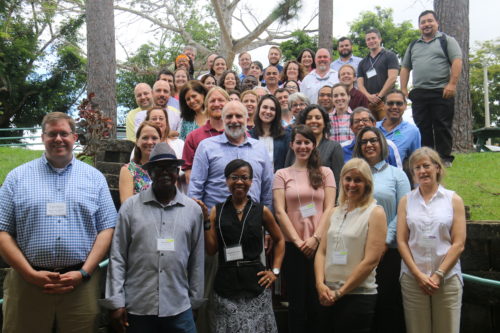
All in all, this was a GREAT workshop. I don’t know if it was being in beautiful Puerto Rico, or it was the gallons of coffee consumed (the most I have ever seen), or the timeliness of having recently experienced a very significant drought and a major hurricane, but the workshop participants were fully engaged, actively thinking and ultimately productive. There were several stars in pulling off this immersive learning experience which was a lot of fun. First of all, Bill Gould worked with Kate Malpeli to get the right people to the venue. At the venue, Nora Alvarez-Berrios helped with logistics, Eva Holupchinski organized the talks, and Tania Gabriela fed us well. The participants were also the Stars, because we did a lot of good brainstorming, had an immersive learning experience, and have begun to create a powerful network (all fueled by caffeine, sugar and alcohol, key ingredients in productivity).

At the conclusions of our ecodrought workshops, I have been performing a song adapted from a previous recorded song. For this workshop in Puerto Rico, I thought the appropriate song to adapt was “Despacito,” written by Luis Fonsi, Erika Ender and Daddy Yankee in 2017. The Despacito music video was filmed in Old San Juan which made it all the more relevant.

Despacito
31 May 2018
William C. Dennison
Yes, you know that I’ve been looking at you for a long tine
Your data it is so compelling today
I saw that the look in your eyes was calling me
Show me the path that I will take (Oh)
You, you’re the magnet and I’m the metal
I am getting closer and making a plan
Simply thinking about it makes my heart race (Oh yeah)
Now I’m already liking it more than usual
All of my senses are asking for more
We cannot do this in a rush
Despacito
I want to understand your drought slowly
Let me analyze data in your region
So that you remember if you’re not with me
Despacito
I want to comprehend your issues slowly
Firmly in the context of your island
And of your data, I want to create a fact sheet
I want to see your precip data
I want to see your drought Index
Want to show you my diagram
Your favorite places (favorite, favorite baby)
Let me assess your vulnerability
And you forget your last name
If I ask for a graph come give it to me
I know that you’re thinking about it
I’ve been trying to do it for awhile
This is giving and giving it to you
You know that with drought your heart goes bom bom
You know that from Water it is looking for a bom bom
Come try my graph and see if you like its trend
I want to see how much data fits in you
I’m not in a rush I want to experience this workshop
Let’s start slowly, then savagely
Step by step, soft then softly
We come against each other, little by little
When you graph me in that state of distress
I see that you are trends and patterns
Step by step, soft then softly
We come up against each other, little by little
And it’s just that your drought is a puzzle
But to finish it here I have the missing piece
Despacito
I want to comprehend your issues slowly
Firmly in the context of your island
And of your data, I want to create a fact sheet
Despacito
I want to understand your data
And of your data, I want to create a fact sheet.
About the author
Bill Dennison

Dr. Bill Dennison is a Professor of Marine Science and Vice President for Science Application at the University of Maryland Center for Environmental Science.