Global use of IAN symbol libraries
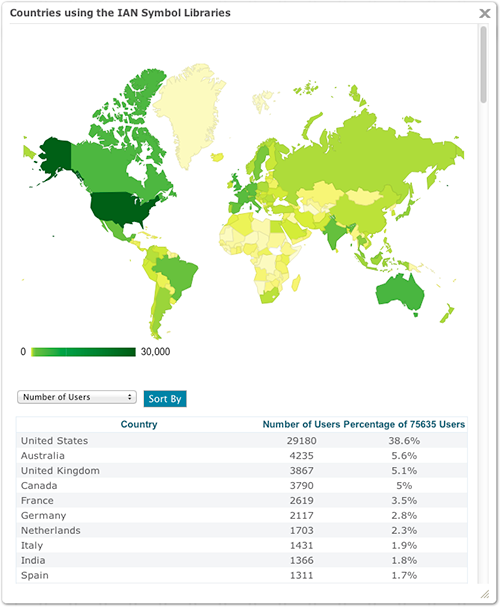
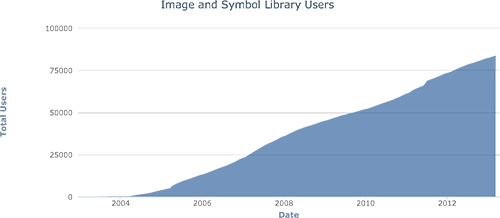
Bill Dennison · | Science Communication |The steady rise in the number of people who have registered and downloaded the IAN symbol and image libraries has continued since they were first posted online in 2003. The number of users is currently in excess of 75,000 people, from all 50 U.S. states and virtually every country in the world. Since we are more interested in disseminating the symbol libraries so that people can more effectively and universally communicate, we have requested very little information about those registering to download the symbol libraries, yet we can glean some insights into the people by analyzing the data that we do have available, which is the subject of this blog post.
The first observation is that the countries where people have downloaded symbols include both English speaking and non-English speaking countries, attesting to the global nature of symbols. The top ten countries in order of total numbers of registered people are the following: 1) United States, 2) Australia, 3) United Kingdom, 4) Canada, 5) France, 6) Germany, 7) Netherlands, 8) Italy, 9) India, 10) Spain. The current data on symbol library registrations is posted on the IAN website.

Since the country's population size will influence the number of symbol library users, data from the World Bank indicators were used to develop a ratio of symbol library users per capita. The results from this analysis were interesting. The symbol user per capita for the United States was 94 users per 1 million people (28,136 users in a country with a population of 311,591,917 people as of March, 2013). There were four large countries (1 million+) with a higher per capita symbol use: Australia = 187, New Zealand = 118, Canada = 110, Netherlands = 104 users per 1 million people. In addition, a dozen countries had over 50 users per 1 million people: Sweden = 93, Norway = 91, Denmark = 81, Switzerland = 77, Belgium = 70, Ireland = 65, Singapore = 65, United Kingdom = 65, Slovenia = 61, Estonia = 56, Austria = 51, Croatia = 51. Apart of the United States, these countries are all either European or part of the British Commonwealth.
There are a suite of small nations that also have higher than average per capita download ratios. These small nations (< 1 million people) were the following: American Samoa, Andorra, Aruba, Bermuda, Curacao, Faroe Islands, Iceland, Monaco, Northern Mariana Islands, Palau, San Marino, Tuvalu, and British Virgin Islands. The two most populous nations on earth, China and India, had relatively low per capita ratios, not surprising considering their large population sizes.

In reviewing these per capita ratios, it is apparent that the relatively prosperous countries are the places where people are using the symbol libraries the most. But one of the motivations for making these symbols accessible via the internet, maintaining a free download service as well as creating the free online conceptual diagram creator was to make symbols more globally accessible to people with less resources. So another analysis was conducted in which the number of users vs. Gross National Income per capita (GNI) was compared. With the exception of the United States, the top ten countries in terms of symbol users per GNI were the following: 1) India = 0.97, 2) Vietnam = 0.24, 3) Indonesia = 0.21, 4) Bangladesh = 0.20, 5) Pakistan = 0.19, 6) Philippines = 0.19, 7) Thailand = 0.16, 8) Mexico = 0.12, 9) Egypt = 0.11 and 10) Brazil = 0.11. This list of countries is interesting, as it includes a more global reach in Asia, North and South America than the per capita population comparisons. These appear to be countries developing capacity in science communication, providing another meaning to the term 'developing nations'.
As the IAN symbol library continues to grow and the number of people using the symbol library grows, we hope to see an expansion of use by people in the developing world who face significant environmental challenges and need to effectively communicate their issues. The online IAN symbol library has received very little direct funding and largely relies on the IAN projects funded to produce assessments and science communication products. It would be interesting to see what would happen if we received directed funds to develop online tools associated with the symbol library. Nonetheless, we hope that the IAN symbol library continues to inspire people to make useful conceptual diagrams and better communicate their issues.
About the author
Bill Dennison

Dr. Bill Dennison is a Professor of Marine Science and Vice President for Science Application at the University of Maryland Center for Environmental Science.