

Humanity’s Place in the Environment: How Social Indicators Strengthen Ecological Report Cards
Antonia Zais · 5 commentsFor over 20 years, environmental report cards have been used across the globe to integrate data into communication products that catalyze management action and increase stakeholder engagement. They allow governmental bodies, major industries, and the general public to easily access regional ecological data and allow comparison among regions. However, only evaluating ecological factors neglects a major component that influences environmental health: humans. The development of the Environmental Justice Index and the inclusion of socio-economic indicators in environmental report cards allows for a more holistic approach to ecosystem-based report cards.1

Indicators and thresholds are an essential part of the design and evaluation processes of environmental report cards. Since the beginning of report card evaluations, factors such as water quality, benthic organisms, phytoplankton, and seagrasses have been commonly used to measure the overall health of marine and estuarine bodies. While these factors are effective at indicating healthy aquatic habitats, they do not capture the bigger picture. “Report Card Fatigue” is a phenomenon of repeating grades year after year despite management changes. This can be a telling sign that the indicators are inappropriate for wholly evaluating an ecosystem’s health.2 The interests and values of stakeholders can also change over time. As they do, ecological indicators no longer accurately represent stakeholder needs. These factors and more generated the need to integrate social components into report cards and initiated the development of the Environmental Justice Index.
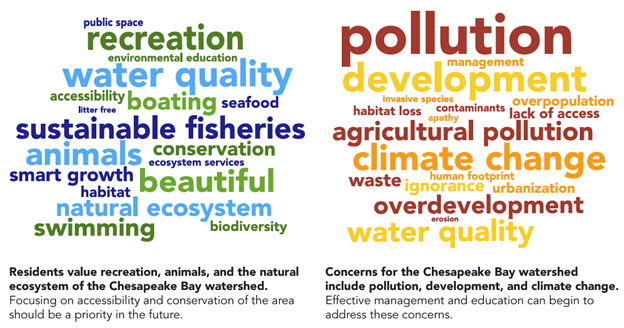
Social indicators were prioritized in the creation of recent report cards like the Chesapeake Bay and Watershed Report Card. These indicators include demographic information, economic factors, and community vulnerability. The Environmental Justice Index (EJI) was developed in partnership with the Integration and Application Network (IAN), the Center for Disease Control (CDC), and the MEES graduate program at UMCES. This index is meant to reflect societal influences on Chesapeake Bay Watershed regions.3 The EJI used in the Chesapeake Bay and Watershed Report Card included three categories of indicators: economic, ecological, and societal. New indicators like heat vulnerability indexes, walkability, house affordability, and income inequality were included in the report card. These social factors help scientists, lawmakers, industries, and the general public recognize local barriers to the management of a healthy ecosystem. Report cards are defensible, scientific documents that can empower communities to rally for change in their region. Elected officials have more pressure and responsibility to support these changes through the enforcement of environmental regulation on damaging industries, reallocation of funding towards social justice initiatives, and the provision of equitable access to wellness amenities.These changes help eliminate barriers to appropriate environmental stewardship.
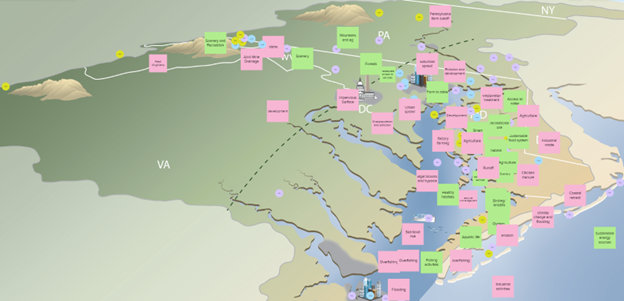
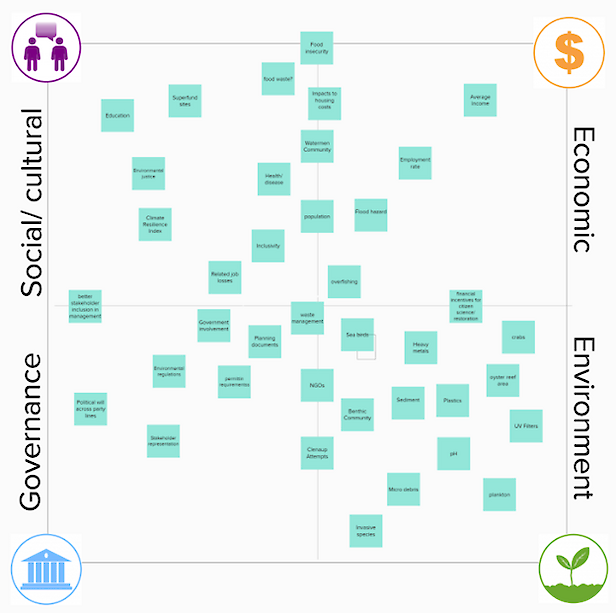
Sustainable development greatly influenced the creation and implementation of the Environmental Justice Index. Sustainable development was first introduced in several world summits like the World Summit on Sustainable Development in South Africa (2002) and the Rio+20 (2012). In 2015, the United Nations developed 17 Sustainable Development Goals for all participating countries to achieve peace and prosperity by 2030.4 The ideals of these goals have been adopted in various sectors, most commonly recognized by the word “sustainability.” Sustainability is commonly represented by three pillars: economic, social, and ecological. The Four Circles of Sustainability, however, include an additional governance section that reflects the management and policy side of sustainability practices. These four domains are useful for determining indicators because they not only help assess socioeconomic aspects, like poverty and industry, but also the effectiveness of management practices.
Focusing on social indicators has many benefits for report cards' processes, results, and perceptions. Modern-day report cards utilize a transdisciplinary approach that incorporates numerous stakeholders from a variety of backgrounds to help co-design and co-produce the product.5 By doing this, organizations broaden their perspectives and knowledge bases on ecosystem health. Incorporating social factors into environmental report cards enriches datasets, emphasizes stakeholder values, and expands the applications of its use. As we discussed in the Science for Environmental Science class, emphasizing the human aspect of the environment makes the data more accessible and is more likely to result in actionable change.
Communities are a major part of ecosystems. Underserved communities cannot support a healthy ecosystem the way more advantaged and sufficiently-funded communities can. When communities are given the resources to support healthy, sustainable lives for themselves, the health of the ecosystem will follow. Using report cards to holistically evaluate a region helps identify systematic environmental and societal disparities that can be mitigated with the help of credible, invested stakeholders.
Sources:
- Integration and Application Network. (2023). Chesapeake Bay Health Showing Significant Improvement Over Time. University of Maryland Center for Environmental Science. https://www.umces.edu/news/chesapeake-bay-health-showing-significant-improvement-over-time
- Dennision, Bill. (2010). Environmental report card grading system. Integration and Application Network. https://ian.umces.edu/blog/environmental-report-card-grading-system/
- Vargas-Nguyen, V.; Fries, A.; Edgerton, J.; Dennison, B.; Anderson, S.; Badri, S.; Lucchese, V.; Laumann, K.M.; Heath Kelsey. (2023). 2022 Chesapeake Bay and Watershed Report Card. Integration and Application Network. https://ian.umces.edu/publications/2022-chesapeake-bay-and-watershed-report-card/
- United Nations. “The 17 Goals.” https://sdgs.un.org/goals
- Vargas-Nguyen, V.; Kelsey, R.H.; Jordahl, H.; Nuttle, W.; Somerville, C.; Thomas, J.; Dennison, W.C. (2020). Using Socioenvironmental Report Cards as a Tool for Transdisciplinary Collaboration. Integrated Environmental Assessment Management, 16: 494-507. https://doi.org/10.1002/ieam.4243
- Harwell, M. A., Gentile, J. H., McKinney, L. D., Tunnell Jr, J. W., Dennison, W. C., Kelsey, R. H., ... & Tunnell, J. (2019). Conceptual framework for assessing ecosystem health. Integrated environmental assessment and management, 15(4), 544-564. https://setac.onlinelibrary.wiley.com/doi/pdf/10.1002/ieam.4152
About the author
Antonia Zais

Antonia Zais is a first-year master’s student of the new Master in Environmental Management in Sustainability program at Frostburg State University in collaboration with University of Maryland Center for Environmental Science. Antonia graduated from Frostburg State University in December 2022 with a B.S. in Geography and Sustainability Studies. While completing her master’s, she also currently works full-time as an Environmental Specialist at the Western Maryland Regional GIS Center at Frostburg State University. Her current research efforts are focused on coal mining and its regional effects in the Chesapeake Bay Watershed. She hopes to further pursue environmental management work by incorporating data visualization, geographic perspectives, and sustainable values into local/state policies.
LinkedIn Profile: www.linkedin.com/in/antonia-zais-88b928281
Next Post > CERF Conference in Portland Oregon
Comments
-
Samantha 2 years ago
I agree that the best way to get people interested in the report cards is to include them and relevant information. People tend to pay attention to think when they have an interest or connection to the problem.
-
Kayla 2 years ago
I wonder if a way to beat that "report card fatigue" is to make the management changes and practices something that can be advertised on the front page of a report. Although report cards are meant for any stakeholder or member of the public to be able to read and understand, I believe that some people still only look at the letter grade on the cover. Clearly stating specific management actions on the front page, may make people feel more engaged.
-
Meghna 2 years ago
The concept of report card fatigue is so interesting to me. If the report card grades are the same, despite management changes, how and what exactly can we improve?? I guess that's a question we are still trying to find the answer to.
-
Joy Amadi 2 years ago
I agree with you Antonia, human well-being is essential when dealing with environmental issues. Therefore, taking socio-economic factors into account while evaluating ecological factors is a more effective way of assessing the environment.
-
Colin Vissering 2 years ago
Antonia - very well written and graphically interesting blog. I think your focus on social and environmental justice indexes highlights just how difficult these are to develop and implement effectively - which is why they may have come later than some of the other environmental indexes. In applied terms, I a connection of your blog discussion with the distribution of funds for federal programs - where the use of environmental justice and other economic indexes can serve to balance inequality in the capacity of communities to apply for and implement grant programs to improve their environmental and economic conditions.