Integrating system dynamics modeling and report cards workshop
Bill Dennison · | Environmental Report Cards | Applying Science |On 9-11 November 2016, a workshop entitled "Integrating systems modeling and report card development to improve basin health & manage trade-offs" was held in Annapolis, Maryland. The systems modeling and the report card approach have a shared philosophy of stakeholder engagement as being the foundation to improving river health globally. Both approaches are also driven by synthesis of scientific data. But they differ in their emphasis on dissemination strategies (e.g., public report cards vs. scientific publications on system models) and on their ability to deliver timely synthetic data summaries of current (Report Card) vs. future (System Dynamics Models) conditions.
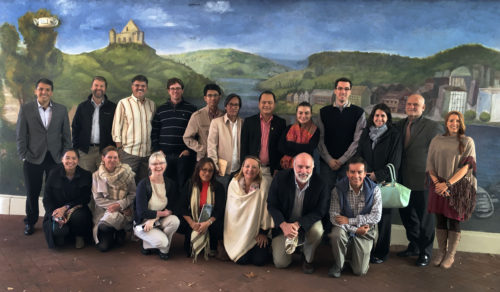
The two teams gathered in Annapolis were the Basin Report Card Initiative (BCRI) team, comprised of personnel from the University of Maryland Center for Environmental Science (UMCES), World Wildlife Fund (WWF) - USA and Colombia, and the Humboldt Institute, and the Linked Indicators for Vital Ecosystem Services (LIVES) team, comprised of personnel associated with the University of Bergen, the Luc Hoffman Institute (LHI) and WWF-Cambodia. The use of environmental report cards to assess and track the status of river basins has been developed by UMCES, and a partnership with WWF has been created to promulgate this approach world wide. Meanwhile, the application of system dynamics modeling for use in environmental management has been developed at the University of Bergen and a partnership with LHI has been created to globally promote its use.
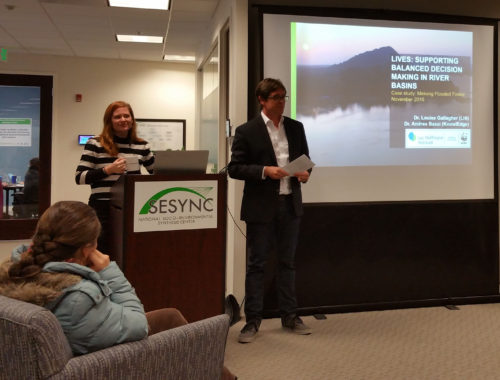
The workshop was kicked off with a seminar at the National Socio-Environmental Synthesis Center (SESYNC) by Louise Gallagher, LHI and Andrea Bassi, KnowLedge Srl. Louise and Andrea talked about using system dynamics models in a variety of applications, including the flooded forest region adjacent to the Mekong River Cambodia. It was in Cambodia that stimulated the discussions about integrating their system dynamics modeling approach with our report card approach.
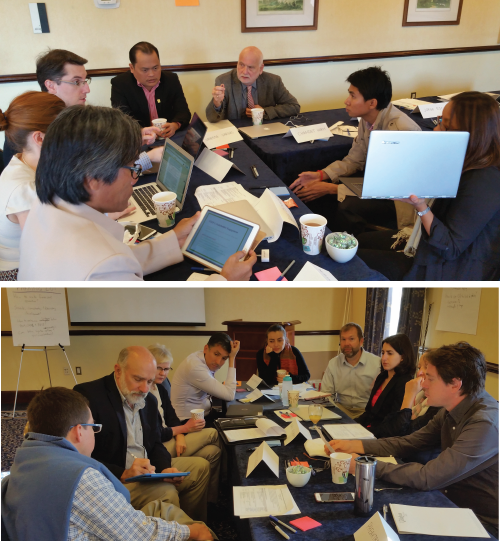
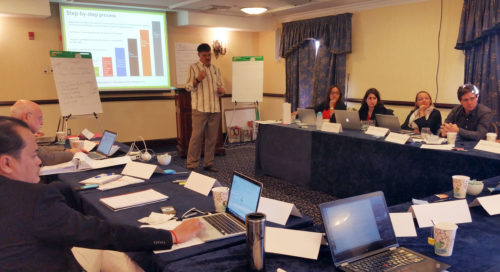
Due to previously scheduled events at both SESYNC and the UMCES Annapolis Office, we held the workshop at O'Callahans Hotel in Annapolis. On the first day of the workshop, we had introductory talks, describing the different tools and approaches employed by the two teams. Annapolis was a good venue for having meals together at a variety of restaurants to facilitate interactions between the different teams.
One of the exercises that we conducted was to develop a causal loop diagram and to develop values and threats ranking using 'Snap', as described previously. Following the creation of a causal loop diagram and prioritized values and threats, the exercise was to compare the two versions of a stakeholder derived conceptual model of what was important to stakeholders, using the Mekong flooded forest example. It was gratifying to find that the two methodologies produced similar conceptual models of what was important.
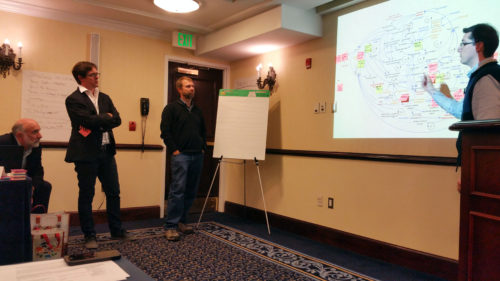
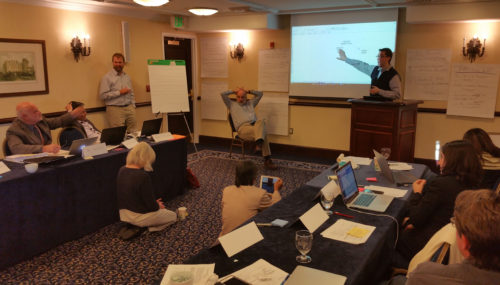
At the end of the workshop, it was determined that resources will be sought to initiate an integrated report card and systems model exercise in a specific river basin in which stakeholders are fully engaged in the process of developing past, present, and future cards. This exercise will generate a suite of products (e.g., report cards, models, websites) targeted for the nominated river basin. In addition, documentation of the process of developing the tools and products will be communicated effectively to facilitate replication in other river basins.
On a personal note, this workshop was held on the days immediately following Election Day for the U.S. President. We compared the jet lag for our participants from Colombia, Cambodia and Europe to our "election lag" from all the cantankerous debating and election advertisements. It turns out that immersing ourselves in a compelling workshop with great food, nice walks, easy logistics and meeting new colleagues was the perfect antidote to the jet and election lag.
About the author
Bill Dennison

Dr. Bill Dennison is a Professor of Marine Science and Vice President for Science Application at the University of Maryland Center for Environmental Science.