

Learn how to storyboard your next visualization publication
Anna Windle ·What comes to mind when you think of storyboarding? Maybe you think of a film storyboard that uses a series of ordered images and directions to visually outline a plot or story.
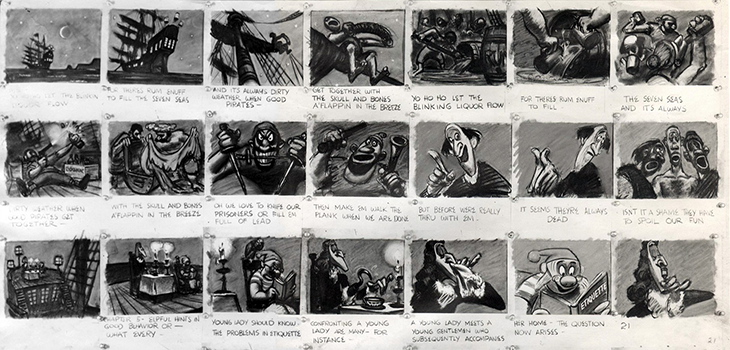
Or maybe your mind goes to a comic book or strip where a story can be visualized through a sequence of illustrations and text.
A storyboard can also be used for science visualizations such as posters, brochures, books, diagrams, etc. In fact, storyboarding should be the first step in making a science communication or visualization piece. Drafting a visual outline of the content you plan to create will help when you begin designing it electronically. A simple pencil or whiteboard sketch of what you want your final product to look like is all you need to begin an effective design. Below are some examples of storyboard sketches from students in UMCES's Integration and Application Network's (IAN) Science Visualization class.
After you've generated some layout ideas by sketching a storyboard, the second step is creating a mock-up electronic version. There are several software programs available to do this, each with pros and cons:
Adobe InDesign: Best for creating publications. Files in document are linked so file sizes don't get huge. Most functional for publications. Learning curve if never used before.
Adobe Illustrator: Flexible layout design. However, file sizes get large since you need to embed all images and objects. Not great at handling text. Learning curve if never used before.
Microsoft PowerPoint: Easy to use, especially with experience making presentations. However, inflexible for printing applications. Color renditions and layout designs are not great.
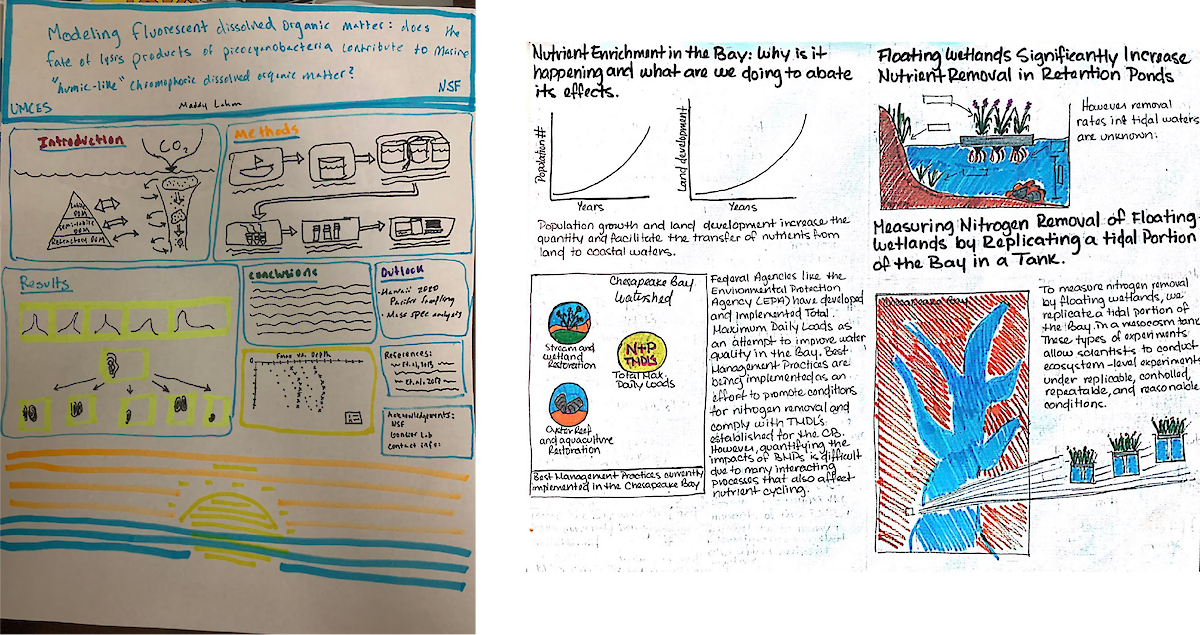
A mock-up electronic version of a storyboard should have examples of where you want photo, text, or objects. You can add placeholder text to fill text boxes. This step helps visualize the layout and flow of a publication. Below are some images of electronic mock-ups from students in IAN's Science Visualization class:
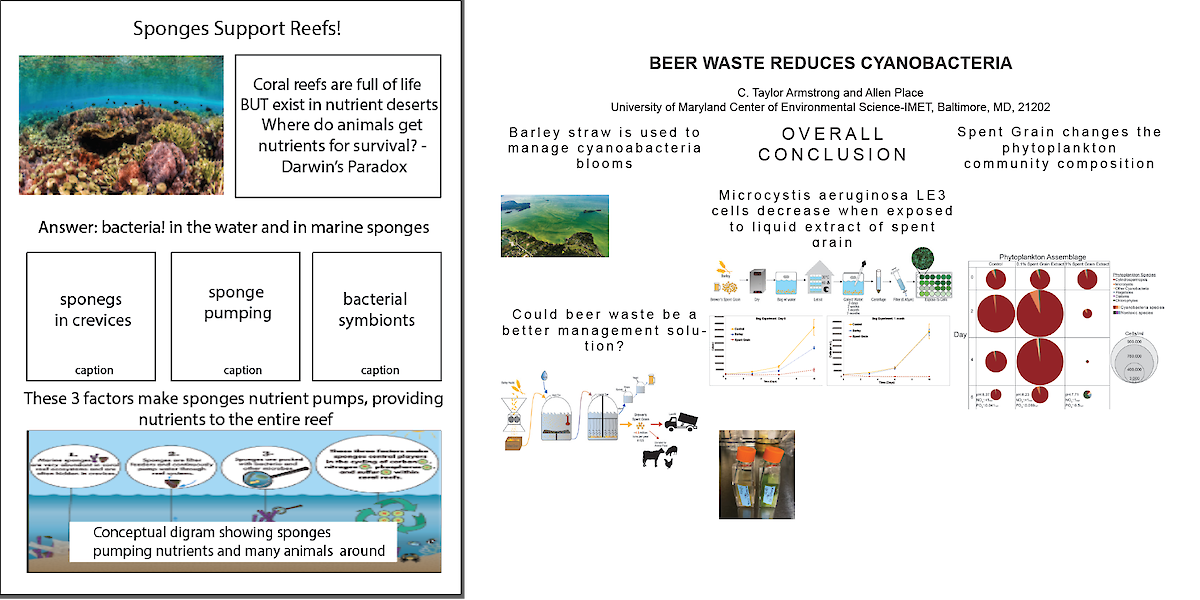
A. B.
Figure 4. Photos of storyboard electronic mock-ups made by MEES 708T students Lauren Jonas (A) and Taylor Armstrong (B)
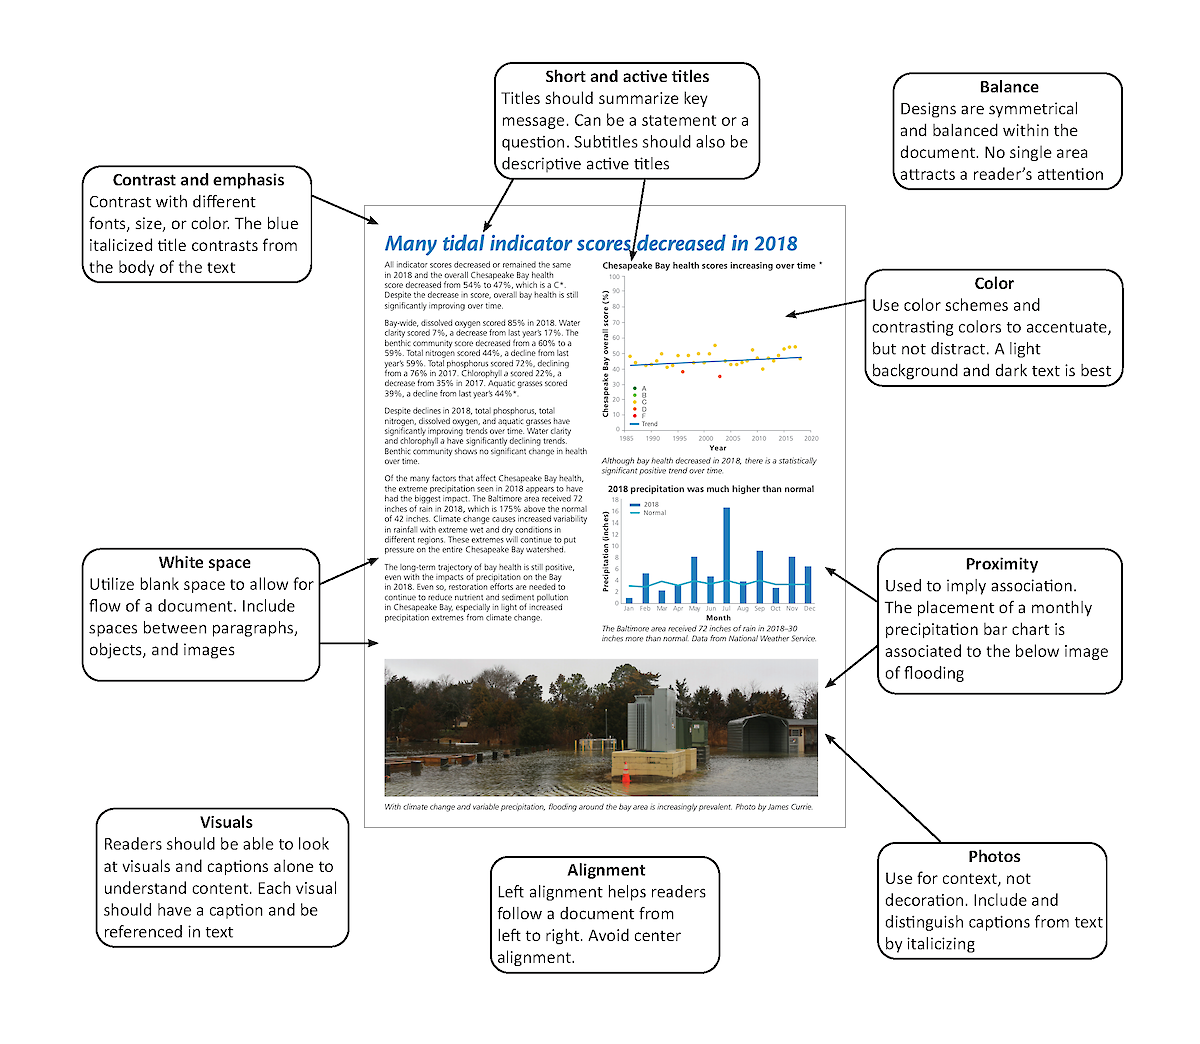
The third step is to incorporate all visual elements and design principles into a final product. Alexandra Fries, science communicator at IAN, discusses general design principles for publications in a helpful online tutorial. Using an example from the 2018 Chesapeake Bay & Watershed Report Card published by IAN, I describe the effective design principles used:
As much as you might want to jump right into designing a final publication piece, you should take the time to think and sketch out ideas beforehand. Also, bounce your ideas off of someone else. They might have another layout design you didn't think about that would enhance your visualization product. Storyboarding is an important step in the early planning part of communicating science that will ensure the overall sense and clarity of the message. Good luck!