Lessons learned during the Long Island Sound report card process
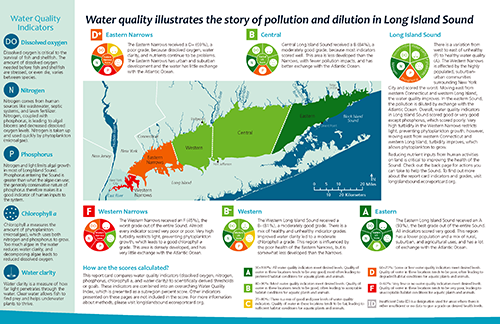
Alexandra Fries · | Environmental Report Cards | Science Communication | Applying Science |Caroline Donovan and I were invited to speak at the joint meeting of the Long Island Sound’s Citizens Advisory (CAC) and Science and Technical Advisory Committees (STAC). After completing the Long Island Sound Report Card in June, they asked us to give some wrap up and next steps information for where the report card is going in the future. Overall, the Long Island Sound report card included water quality, human health, and ecosystem/habitat indicators. For the first version of the report card, only the water quality indicators were used in the overall report card scores. These five indicators are dissolved oxygen, total nitrogen, total phosphorus, chlorophyll a, and water clarity (Secchi). These indicators were scored based on many calls and meetings with the Long Island Sound STAC. The scores were determined for each of the five reporting regions, from the Western Narrows to the Eastern Long Island Sound. The water quality scores illustrated the story of pollution and dilution in Long Island Sound.
Media coverage for the report card was widespread and greatly successful. Outlets in both Connecticut and New York picked up the story. The report card process also led to many achievements such as fostering collaboration and engagement with local groups, involvement by the LIS STAC and CAC, identifying monitoring and knowledge gaps in LIS, increasing shared responsibility and accountability of groups working on LIS, and three report cards: the overall LIS report card as well as the Inner Hempstead Harbor Report Card and the Norwalk Harbor Report Card.

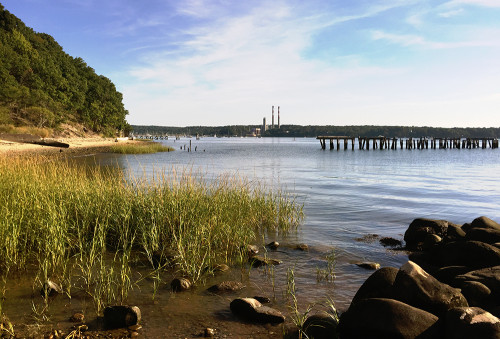
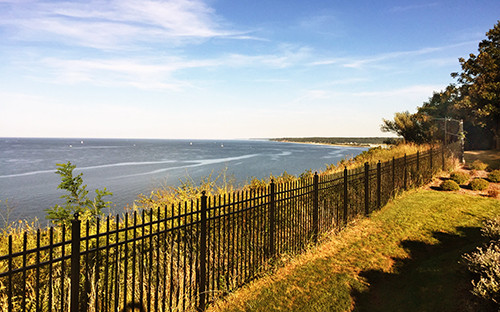
We drove up from Maryland and arrived the day before the meeting on September 16th in the afternoon. Since we had been in the car all day, we decided to go to a nearby park to see the Sound since we’d be in a meeting room the following day. We ended up at McAllister County Park in Brookhaven, NY, which overlooked Long Island Sound on the northern side, and Port Jefferson Harbor on the southern side. The park is 113 acres, mostly accessible by boat. But, there is a small public parking area, with access to beautiful views and a peaceful beach. You can watch the Bridgeport-Port Jefferson ferry come into the harbor and unload and load passenger cars and people.


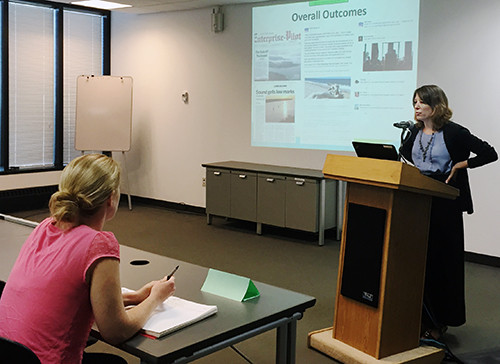
The following day we went to the meeting, which was held at Stony Brook University in the Wang Center. Caroline gave a talk about the Long Island Sound Report Card next steps and improvements. While biological indicators are included in the report card, they were not included in the overall score for this first year. In the future, biological and ecosystem indicators will be incorporated into the overall grade. This is one of the key changes to be made in future report cards, and will include indicators such as finfish, piping plover, and eelgrass.
There was a lot of good discussion and praise for the report card as well as ideas to make the next version even better. A key discussion that occurred in the meeting was the idea of human health versus ecological health. Stakeholders and members of the STAC and CAC stressed the importance of human health inclusion in the report card. For the first version of the report card, information on shellfish and bacteria in the Sound was included but a scoring system was not established. These, along with other important indicators, can help tell how safe it is to consume fish, shellfish, and to swim in Long Island Sound, which are key messages to communicate to the public.

In addition to the Long Island Sound report card, report cards for two embayments of the Sound were created. Working with the Hempstead Harbor Protection Committee, and the Coalition to Save Hempstead Harbor, we assessed the health of the Inner Hempstead Harbor. This report card included data on dissolved oxygen, dissolved inorganic nitrogen, and water clarity (secchi). Working with Earthplace’s HarborWatch, we assessed the health of the Norwalk Harbor. Indicators for Norwalk included dissolved oxygen, water clarity (Secchi), fish, crustaceans, and other invertebrates.
While these embayment groups are doing exceptional monitoring and restoration work in their harbors, the process of putting together the embayment report cards led to a general feeling that there is not enough of the right kind of data for embayment report cards just yet. Due to the lack of consistent indicators and lack of spatial and temporal monitoring needed for a comprehensive review, it was difficult to see a clear picture of health in the embayments.
How can we address this issue in the future? That is the question that will need to be explored over the coming years. One, a cohesive monitoring protocol for all embayment report cards may need to be established. But, first, buy-in and support from the overall LIS community (state and federal agencies, local jurisdictions, and volunteer monitoring groups) will need to occur. Currently, embayment groups are working in isolation, spread out around the Sound and with little funding. Furthermore, establishing how embayments can be compared to the open waters of the Sound is also a key need. Should embayment indicators be the same as indicators for the open waters of the Sound? Should the thresholds against which these indicators are scored also be different? Additionally, it can be argued that the embayments on the Long Island side of the Sound are physically and biologically different from the Connecticut embayments. There is a wealth of information out there that will provide the basis of our decisions, including monitoring data, literature reviews, and institutional knowledge. And, all partners will need to be at the table to collaboratively work toward the end goal of producing embayment report cards. The next few years of this work will be exciting, highly collaborative, and dynamic!
About the author
Alexandra Fries

Alexandra is a Program Manager at the Integration and Application Network (IAN) based at the University of Maryland Center for Environmental Science in Annapolis MD. Alexandra’s work in environmental management has been focused on assessment, monitoring, and management of aquatic, marine, and terrestrial ecosystems. Alexandra has extensive experience in data analysis, synthesis, mapping, interpretation, and communication. Alexandra has experience working with a diverse group of partners including those in local, state, and federal government, non-governmental organizations, non-profit organizations, private industry, and academia. Within IAN, Alexandra conducts data analysis, synthesis, and communication by completing environmental report cards, updating the IAN website, and conducting science communication courses. Alexandra also creates science communication materials such as diagrams, posters, presentations, newsletters, and reports using Adobe Creative Suite, Microsoft Office Suite, and ArcGIS. Alexandra has experience managing projects and staff on local and international projects, liaising directly with partners and colleagues, and providing insights on project direction and goals.