Making the Grade
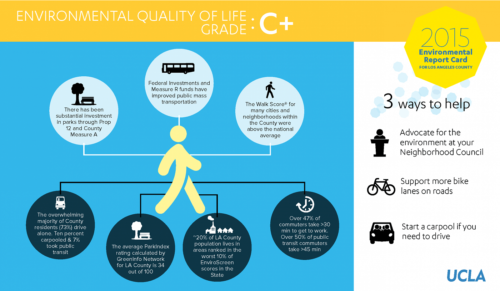
Annie Carew, Qiurui Zhu · | Environmental Report Cards | Science Communication | 11 commentsWe’ve spent a lot of time this semester discussing the intersection between science and the public - how can we communicate the importance and urgency of our science without alarming or confusing people? This week, we discussed environmental report cards, which could provide a solution to this tricky balancing act facing scientists.
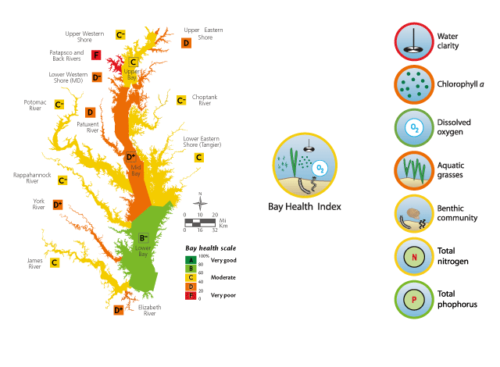
There are several organizations that write and publish environmental report cards. The Integration Application Network is one such organization1. The procedure is relatively straightforward: choose the metrics, gather the data, then analyze and present that data. In our Science for Environmental Management class this week, we delved into the reasons why straightforward doesn’t necessarily mean simple.
As we all know from many years of school, grades require tests—something by which to measure success. However, if different people are taking different tests, how can we reliably compare their grades? The same is true of ecosystems. Ecologists are constantly faced with the issue of scale. We are asked to make broad predictions and comparisons from focused data. We can’t compare different systems based on their individual metrics, but we can compare the overall health of ecosystems by comparing their report card grades. Choosing the appropriate metrics by which to grade each ecosystem is a challenge in and of itself.

In our discussion this week, we asked about the prevalence of biotic indicators as opposed to abiotic ones. It sometimes make sense to look at the presence and health of specific species, whose successes reflect the overall health of the ecosystem. Additionally, individual species tend to be charismatic and of interest to the public. Garnering interest from the public is a goal of environmental report cards, so why not use fish or frogs instead of nitrogen content? Biological indicators can be a powerful integrative tool for ecosystem report cards, so perhaps we should utilize them more.
The reason they are not used more frequently is that we want to publish ecosystem report cards annually, and monitoring and updating biological indicators is often difficult. Additionally, repeating the biological survey on an annual basis can be expensive and time-consuming. It can also be difficult to assess the success of a species when the factors affecting that species are external; for example, the striped bass population is affected by nutrient inputs from outside the Chesapeake Bay2. We agreed that it was important to promote these biological factors in ecosystem report cards, because that’s what people care about, but such biological assessments are difficult.
Once the appropriate ecosystem metrics have been selected, they must be weighted by importance. As with the metrics themselves, the processes of weighting them is subjective and difficult to standardize across systems. Report card weighting should also be adaptive, to reflect the changing system and adaptive management strategies.
From our discussions about metrics and weighting, we came to the conclusion that transparency is key when creating environmental report cards. It is vital that the report card’s audience—citizens and stakeholders—understand the process behind the report card. We’ve talked a lot this semester about science communication, and the difficulty of putting science into layman’s terms without oversimplifying. We run into this problem again with environmental report cards, which are the result of large data collections that must be presented concisely.

Hand-in-hand with transparency is the importance of appropriate language. Most scientists are comfortable with the term “model uncertainty,” which simply expresses the fact that there is the potential for a range of results from a scientific model, some of which will be inaccurate. However, most people see "uncertainty" as a negative concept. If a model has uncertainty, it isn’t a good model in their minds. We talked about different ways of expressing model uncertainty without using the word "uncertainty." This hearkens back to a discussion we had several weeks ago about the use of certainty qualifiers in IPCC reports, which quantify statistical certainty in data and projections.
Another question weighing heavily on our minds is the future of environmental report cards under the new administration. The amount of government control over data collection varies geographically. In the Chesapeake Bay, for example, federal funding supports much of our monitoring. Some of that money goes to state agencies, but some of it also goes to universities or private consulting companies. For the most part, report cards rely on data from monitoring agencies and citizen science programs, because these groups standardize their data collection methods and locations, and produce the long-term data necessary to maintain report cards. It is difficult for report cards to use data from universities or companies because data collection varies depending on what projects are taking place. If federal budget cuts affect monitoring programs, report cards would be negatively impacted. However, report cards can help prioritize what is necessary to continue monitoring, what data we really want, and which indicators are most integrative and important for the overall health of a system. Another factor to consider is that, while initial report card formation requires a lot of resources, maintenance of that program through subsequent years is much less expensive and labor-intensive.
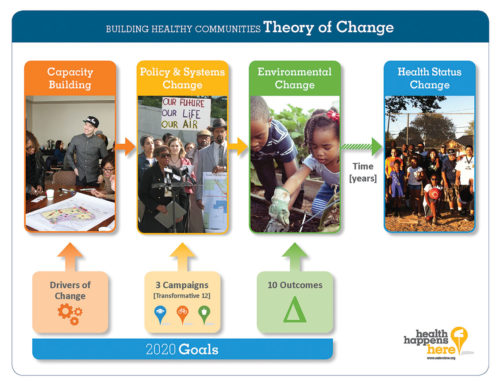
Just as funding sources vary geographically, so can the efficacy of and response to report cards. We discussed whether report cards are impacted by the type of government in place. Some democratic countries implement very effective monitoring programs, while others are less effective; and the same holds true for communist or autocratic nations. There are cases where governments are willing to span borders for the sake of ecosystem monitoring, but they are hindered by external forcing pressures such as war between nations. The World Wildlife Fund utilizes the “theory of change”3 to systematically think through the necessary changes to a system, and how the actors in that system interact with each other, and how the products of the system reach the people who need to make the change.

Having local contacts who can network across disciplines, agencies, and locations is vital. Systematically mapping the connections between people and agencies allows for the selection of people who are more connected and better able to spread information. It’s the difference between using Paul Revere and that other guy when the British were marching on Lexington. Dr. Christina Prell4 at the University of Maryland in College Park is a social network analyst whose work, focusing on the interactions between social networks and the environment, will be extremely useful in finding our Paul Reveres.
A special thank-you to Dr. Heath Kelsey for writing an excellent blog on environmental report cards, and for joining us for discussion this week. Dr. Kelsey leads the report card program at the Integration and Application Network.
References:
1. About ecohealth report cards. University of Maryland Center for Environmental Science.
2. Striped Bass. Chesapeake Bay Program.
3. Markets Institute: Frequently Asked Questions. World Wildlife Fund.
4. Christina Prell Ph.D. Maryland Population Research Center.
Next Post > Marching for Science in Washington, D.C.
Comments
-
Ana Sosa 9 years ago
I really like this blog, my favorite quote was: "Hand-in-hand with transparency is the importance of appropriate language." I think that this is something we often forget as scientists. Adapting or message to our audience is crucial to transmitting it.
-
Kavya Pradhan 9 years ago
Great job Annie and Qiurui! The point you made about the utility of report cards in not just summarizing the health of the ecosystem, but also in identifying important indicators is a really important one. In cases where resources are limited, targeted monitoring might be the only way to keep an eye on the state of the environment. The only concern that I would have in this situation is that often, we do not know how valuable the data we are collecting is and such a monitoring strategy would probably contribute to the lack of baseline data in the future.
-
Hadley McIntosh 9 years ago
Great blog! I think making report cards for the public is really important in engaging their interest. Many people are curious about where they live, but it isn't until they see something familiar - like a grade or rating - that they know what condition it is in. Too often we forget what an area used to be like and having these report cards with anecdotal evidence will hopefully encourage more people to preserve the water bodies near them!
-
Alterra Sanchez 9 years ago
"As we all know from many years of school, grades require tests—something by which to measure success. However, if different people are taking different tests, how can we reliably compare their grades?"
"Additionally, individual species tend to be charismatic and of interest to the public.... [however, we want to] publish annually... and monitoring and updating biological indicators is often difficult."
These quotes, I think, sum up the goals and difficulties of report cards perfectly: make literature/media that accurately and quickly portrays the state of an ecosystem and is interesting/engaging to the public. However, I wonder if biological indicators can't be incorporated into reported cards every 5 years. They could still be published annual, but then there could be a "special" report card that includes all of the regular indicator, but than also the status and info on 1 or 2 star species of that ecosystem. This might also help scientists, as well as the public, see how efforts have helped these loved species, and it might give people something to look forward to, i.e., increase citizen science effort with a clear goal in mind!!!
-
Ginni La Rosa 9 years ago
Nicely done! Our discussions helped me to realize what a complex undertaking it is to formulate report cards that are both understandable and effective. I also enjoyed the American history refresher using the link to the Paul Revere story.
-
Qiurui 9 years ago
Good job. This blog covers every detail we discussed on class. It is interesting to see the example of Paul Revere at the end of the blog.
-
Katie Martin 9 years ago
I liked the discussion point Ginni brought up about changing the grading scale to be relevant to what is used locally. It was interesting to learn that even though Australia doesn't usually use A,B,C it was familiar enough that it was still used. This ties in nicely with what you said about social networks and Paul Revere vs "that other guy", which made me laugh. Good job!
-
Hao Wang 9 years ago
Nice blog. Making report cards for public people is very important because it is easy to understand only through the color and the 'ABCD' status.
-
Jake Shaner 9 years ago
I find your link at the end of the blog to "the other guy" pretty entertaining. Wasn't expecting to learn about early United States history, good use of links. As far as report cards go, I think the blog did an excellent summary of the discussion. It didn't really occur to me before this class and blog just how difficult it really is to produce an effective report card. Communication between the data takers and compilers is key, to make sure that data being taken is actually useful for public education (which some might argue is even the duty of state and federal agencies considering they are funded by public tax dollars).
-
Dylan Taillie 9 years ago
Thanks for the great blog, Annie and Qiurui! I agree that the choice of stakeholders and interested parties is very important to the report card process, and just want to emphasize that. Not only is it important in the 'Paul Revere' aspect of having the correct connections to really spread the information, but it is also to important to choose stakeholders who really cover all aspects of the ecosystem and are easy to work with and compromise with. I also really like the WWF graphic that shows how the different community, political and environmental aspects work to ultimately improve the health of an ecosystem.
-
Juliet Nagel 9 years ago
Well written blog that sums up our discussion well. It was amazing how many people are involved in creating and producing these environmental report cards, from those on the ground who collect the data, to the stakeholders who help decide what metrics are important to measure, to the folks that actually design and write the report card. Such a massive undertaking over a broad scale, but worth it for the impact it has.