Stoplight colors for environmental report cards
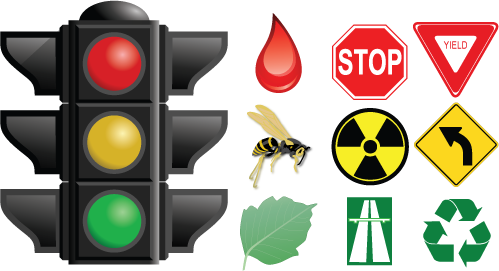
Bill Dennison · | Environmental Report Cards |The use of red, yellow and green for denoting different levels of concern in environmental report cards has its origin in human perceptions of color. The color red is associated with blood and fire, which are instinctively perceived as 'danger'. Red is classified as a 'warm' color and infrared light is essentially heat. The color yellow is associated with warning, like a wasp with its yellow and black bands. The color green is associated with healthy vegetation, like tree leaves or grass. Traffic signs have adopted these color perceptions. For example, bright red stop signs indicating 'stop', or yield signs with red borders are used to create the highest level of concern to drivers. Yellow signs indicate caution, such as a diamond shaped sign with arrows indicating turns or other road hazards. In addition, radioactivity or pathogenic symbols are black on yellow. Green road signs are used to convey location information. Green is also used in depicting recycling or nature.

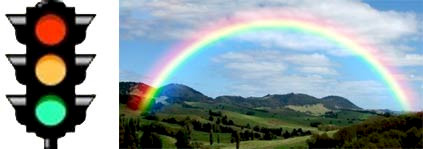
Interestingly, the sequence of red on top, yellow in the middle and green on the bottom used in traffic lights is the order of the appearance of these colors in rainbows. The highest color bands in rainbow are reds, with orange immediately below, followed by yellow and green. An additional set of colors that we use in report card graphics are orange to separate red and yellow and lime green to distinguish from dark green. These additional colors result in a five color scheme that is relatively easy to discern and keeps within the traffic light scheme.

Another color sometimes used in denoting report card categories is blue. Blue is associated with sky or water, and is a 'cool' color that contrasts with red. Blue is also at the opposite end of the rainbow as red. Blue is not used often with traffic signs, although some signage like hospitals or location information uses blue. When blue is used with environmental report cards, it can create ambiguity. Is blue better than green, or not quite as good? The fire danger signs use blue as slightly more danger than green, but several report cards like the National Estuarine Eutrophication Assessment use blue as the least concern, rather than green. At the Integration and Application Network, we attempt to avoid using blue in report cards to avoid ambiguity.

The other aspect of using stoplight colors relates to the action that the report card score attempts to invoke. For example, the use of red, which means 'stop' in a traffic light, also connotes the need to stop and consider carefully what to do next when associated with an environmental report card. A red score means that something is seriously awry and some major intervention is required to get things back on track. Green has the opposite effect, just as green means 'go' in traffic signals. The use of green can mean that it is OK to proceed with current activities or even development, as the environmental status is good.
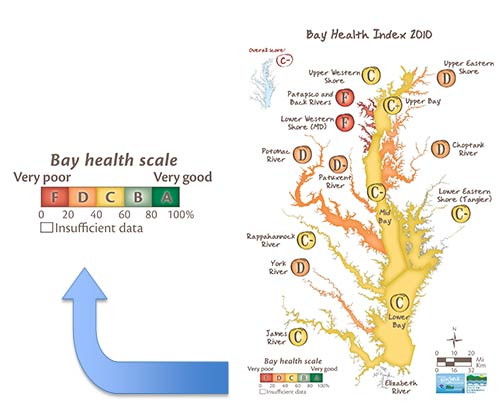
With any color scheme used, it is the indicators and thresholds that determine the color assigned to a reporting region. Choice of indicators and thresholds can make everything red (bad) or alternatively everything green (good), but it is the relative comparisons that are most meaningful, so having the full stoplight range from red to green is preferable.

The use of color in any science communication product is important. Environmental report cards tend to concentrate on a few stoplight colors, but conceptual diagrams typically use a wider array of colors, including brown earth colors as well as black and white. The use of colors in these products should be carefully considered as well.
About the author
Bill Dennison

Dr. Bill Dennison is a Professor of Marine Science and Vice President for Science Application at the University of Maryland Center for Environmental Science.