The Mississippi River Watershed Report Card is released
Heath Kelsey · | Environmental Report Cards | Applying Science |On October 14, 2015, in St. Louis, Missouri, I unveiled the Report Card for the Mississippi River Watershed, a project that almost everyone on the IAN Science Communication team has worked on at some point since 2012. The event was on the roof top patio of at the Hyatt Regency at the Arch in Downtown St. Louis, with great views of the river and the St. Louis Arch. About 75 people from the Steering Committee, Corps of Engineers, municipal, state and local government, academic and non-governmental organizations that have been involved with us on this long journey. There was a feeling of excitement in the room for this report card, because it represents a culmination of such a long and involved process, and because it represents a new milestone in our ability to use report cards to report on broadly differing management goals, across such a large geography.

For me, this project started at a meeting in Peoria, Illinois in 2012, where I talked about report cards to much of the steering committee of America's Great Watershed Initiative, a relatively new group designed to advance holistic management of multiple goals in the Mississippi River. Having just come off the Great Barrier Reef Report Card project, I was feeling pretty good about our ability to create report cards for iconic systems and thought this would be a worthy challenge. Later that year I attended the America's Great Watershed Initiative Summit in St. Louis to help take the idea to a larger audience, and the commitment to launch the report card was born.
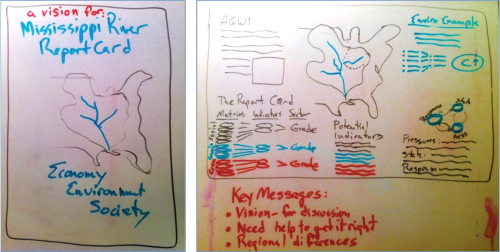
Over the next two years we worked with the newly renamed America's Watershed Initiative to create the report card from an intense and inclusive process that took us to 8 major workshops of up to 50 people representing each of the 6 goals of the initiative: Ecosystems, Flood Control and Risk Reduction, Transportation, Water Supply, Economy, and Recreation. To do this, we went to:Moline, Illinois; Cincinnati, Ohio; Memphis, Tennessee; Nashville, Tennessee; Tulsa, Oklahoma; Rapid City, South Dakota; Kansas City, Missouri; Arlington, Virginia; and Baton Rouge, Louisiana. During that time we engaged over 500 people directly in the workshops and web meetings trying to distill the indicators, data sources, and interpretation that would tell the story of the Mississippi River from the 6 perspectives represented by the goals

In October 2014, we presented the preliminary results of the report card at the Summit in Louisville, Kentucky, and although we were excited to present it, we were not finished. We received lots of feedback from the meeting that suggested that although we were on the right track, we really didn't have it right; we were not telling the right story in the right way, and we needed to work on it. To get the story right, we created a series of work teams to help us revise the indicators, data sources, and interpretation for every goal. We talked to scores of new people, got lots of great ideas, and refined the data analysis, interpretation, messages and our story.
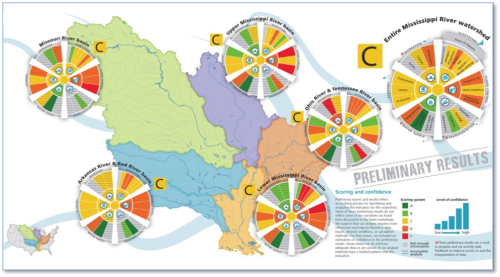
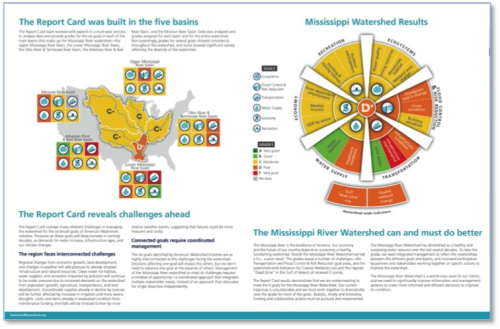
The results of that revision process led us to the final version of the Mississippi River Watershed Report Card that I presented in St Louis. After such a long and complex project, it felt good to get it out there in public. I am very proud of the work we've put in on this project, and I feel good about the report card and the stories it tells and the advancement that it represents in report cards. Each indicator, goal, and basin has an individual story.
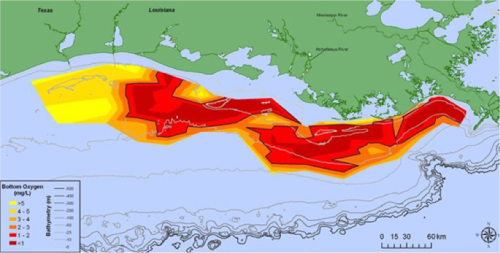
The Ecosystem story is about habitat and the impacts of nutrient delivery to the Gulf of Mexico, and sediment delivery to the coastal wetlands of Louisiana. Nutrient loads are too high, creating the huge hypoxic zone in the Northern Gulf of Mexico, and not enough sediment is available to reverse the enormous loss of wetland area in coastal Louisiana, let alone keep up with the impacts of sea level rise, subsidence, and erosion.
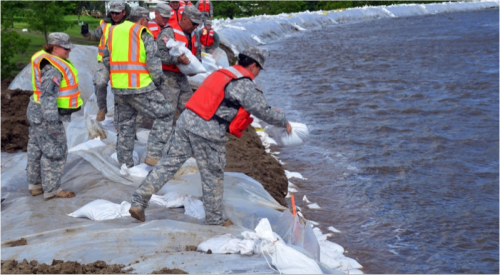
Flood control tells a story of some community preparedness, but an increasing percentage of population living in flood prone areas. There is an extensive system of levees providing flood protection throughout the basin, but we have information on the condition of very few of them. Despite these concerns, the flood of record in 2011 created minimal property damage and no loss of life - an amazing achievement.
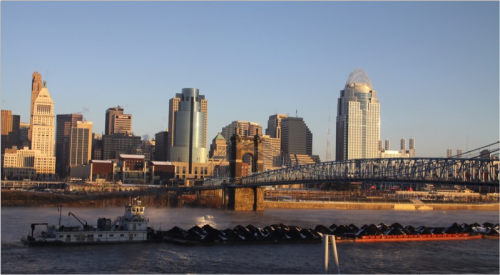
Transportation has a three-part story that tells of an agency tasked with the overwhelming responsibility to maintain the infrastructure that keeps the most efficient bulk river transportation system in the world operating smoothly. For the most part, the system works smoothly despite a small but important percentage of critical infrastructures in failing or near failing condition and lack of secure funding for Operations and Maintenance. These three elements suggest that the system is hanging on but is headed for trouble, with potentially devastating financial and economic consequences.
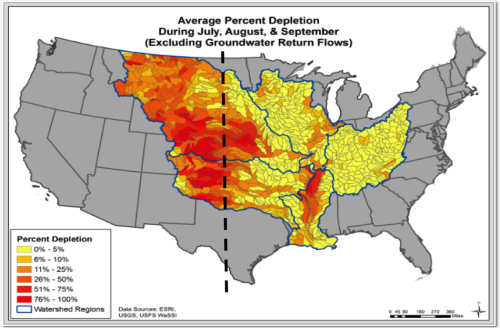
Water Supply results show a clear gradient in summer water stress where in the East, where there is plenty of rain, water demand is met or more than met by surface water availability, whereas in the West, the arid conditions create a deficit, where water demands can't be met by surface water, and groundwater makes up the difference. To date, there is a disturbing lack of information about how long the supply in the nations biggest aquifers can last. Add the impacts of a changing climate and the importance of the problem only increases.
The economic story is both the easiest and the hardest to tell. Clearly the Mississippi River has a globally important economic importance. 92% of all of the US farm exports are transported along the Mississippi River corridor and the agricultural productivity in the watershed was a major factor in allowing the US to become the world power that it is. But it is difficult to measure the effect that the river, tributaries and watershed have on our national, state, and local economies. New and creative analyses are needed to allow us to tell the economic story of the watershed and its basins.

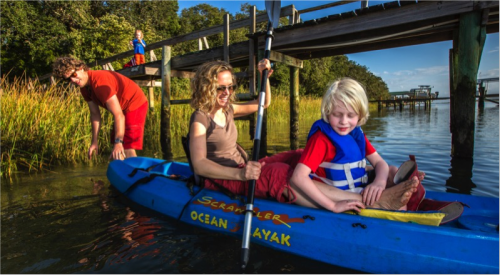
Recreation is a story of people using the world-class recreational opportunities that exist in the basin. People value the ability to use the waterways and watershed for hunting, fishing, bird watching, boating, and other outdoor activities throughout the basin, but the trends in numbers of people participating vary among the basins. Although we can observe the trends, we don't yet know what is driving them, nor do we yet have all the data and information we want to fully describe them. Boating use and water access are two important potential pieces of the recreation story that we don't yet adequately tell. We are convinced the data are out there, but they will take more effort than we have to give at this point to uncover and aggregate them.
Although many parts of the story may appear to be negative, the object of the America's Watershed Initiative is to find ways that the goals can be improved in a holistic way. Our hope is that we can find ways to improve many goals simultaneously. And there are good examples of where that is already happening. Bill Dennison and I were at a conference in LaCrosse, Wisconsin in September, and were invited to tour Pool 8, the reservoir that was created by the installation of a dam upstream of LaCrosse on the Upper Mississippi River. The installation of the dam destroyed the wetlands and braided streams that had been a feature of the system there.

To restore these habitats, material dredged from the channel to support barge traffic is used to create islands, backwaters and complex systems. Seasonal water "draw downs" are used to (somewhat) mimic environmental flows, and expose the stream floor, allowing native vegetation to grow, further enhancing the wetland and benthic habitat. Although this is not perfect - it is not at all the same system it was before the dam - it is supporting good habitat for migratory wildfowl, recreation, clean water, transportation and flood protection. These are the types of tools that can be used to advance multiple goals.
About the author
Heath Kelsey

Heath Kelsey has been with IAN since 2009, as a Science Integrator, Program Manager, and as Director since 2019. His work focuses on helping communities become more engaged in socio-environmental decision making. He has over 15-years of experience in stakeholder engagement, environmental and public health assessment, indicator development, and science communication. He has led numerous ecosystem health and socio-environmental health report card projects globally, in Australia, India, the South Pacific, Africa, and throughout the US. Dr. Kelsey received his MSPH (2000) and PhD (2006) from The University of South Carolina Arnold School of Public Health. He is a graduate of St Mary’s College of Maryland (1988), and was a Peace Corps Volunteer in Papua New Guinea from 1995-1998.