

The Wonderful World of Mapping!
Isabel Sullivan · 17 commentsWhat a time to be alive! We are in the age of mapping with big data, meaning that not only do we have lots of information, but we are able to use improving technologies to present this information in a spatial context.
That being said, we are living in times of racism and injustices within our societies, and within our systems and institutions. Even with the extensive amount of data and increasing mapping access, we consistently see the ramifications of our unjust societies through environmental means. Because of this, our class is working on improving the Chesapeake Bay Report Card to include parameters that will measure some of the environmental injustices along the Chesapeake Bay.
Prior to our class this week, groups were tasked with coming up with indicators, thresholds, and data sources relating to an environmental justice index.The first group presented on a variety of indicators including:
- Commercial fishing with a threshold of percent non-white watermen (through permits, licenses, fish dealers, & vessel landings)
- Incarceration with a threshold of felon disenfranchisement
- Homelessness with a threshold of percent homelessness
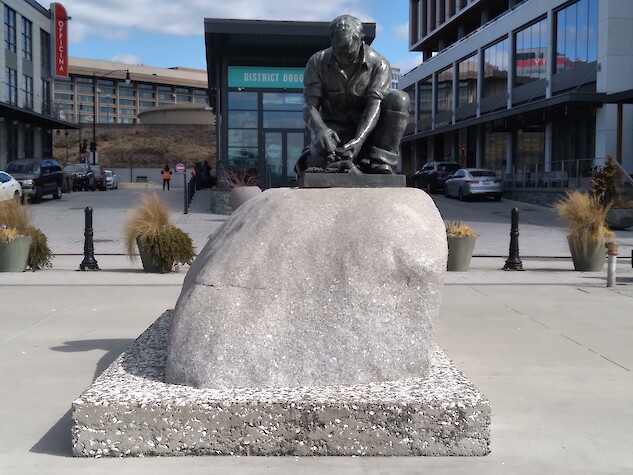
A sculpture donated to the Washington D.C. Wharf by the state of Maine to show the connection that each state has livelihoods based on the water. Photograph by Isabel Sullivan.
On this last point, the question of accurate metrics came up. Faith, a member of this first group, pointed out that environmental justice may tentatively be reached when a low percentage of homelessness is reached. This brings up the importance of defining environmental justice. The selected definition of justice in this report card will determine if this percentage is decreasing as a result of adequate or inadequate housing.
In the second group, three topics were covered, and below are measures or indicators for these topics:
Socioeconomics and Demographics:
- Race, economic status, education, etc. are all parameters in EJ Screen
Management and Governance:
- Representation, community support/empowerment, informed policy-making, and equitable inclusion in decision-making
Sea-level Rise/Coastal Flooding:
- Tide gauges, Surging Seas Risk Zone Map, NOAA sea-level rise viewer, and FEMA flood maps
From both presentations, we can see that data has not only been collected but is available in a mapping format. Sadly, this information is being overlooked and/or undervalued by people who can turn this information into action. We cannot overlook the harsh realities of environmental justice. As cited in the presentation for group two, Van Dolah et al. (2020) states that socio-ecological system discussions require people with diverse backgrounds to be at the table. Without insight from communities, a report card is meaningless from an environmental justice standpoint. This is why the next step in this course is the identification of stakeholders that are willing to co-create a meaningful and informative indicator for communities across the Chesapeake Bay area.
While we can make all the maps we want with these and other sources, if these maps are not put into an appropriate perspective, we lose significance. Reaching out to stakeholders whose voices have not been previously represented can contribute experiential knowledge and provide better indicators for environmental justice on this report card.
References:
Van Dolah, E. R., Miller Hesed, C. D., & Paolisso, M. J. (2020). Marsh Migration, Climate Change, and Coastal Resilience: Human Dimensions Considerations for a Fair Path Forward. Wetlands, 40(6), 1751–1764. https://doi.org/10.1007/s13157-020-01388-0.
About the author
Isabel Sullivan

Isabel Sullivan is a second year master’s student in the University of Maryland’s Marine Estuarine Environmental Sciences program, with a concentration in Ecological Systems. She is advised by Dr. Gerald Wilkinson studying the effect of hibernation on DNA and aging. This research is part of a larger project by Dr. Steve Horvath at UCLA working to create an epigenetic clock that can be applied to the aging and epigenetics of all mammals.
Next Post > Facilitating a Great Barrier Reef partnership workshop in Brisbane
Comments
-
Amber 5 years ago
Thanks for outlining some important factors that will need to be considered in determining where environmental injustices have/are occurring. Reaching out to stakeholders to understand which factors are most valuable will be a critical step in determining which should be used.
-
Andrea M Miralles-Barboza 5 years ago
"While we can make all the maps we want with these and other sources, if these maps are not put into an appropriate perspective, we lose significance. " Yes! Completely agreed, a lesson all scientists in all fields need to reckon with. Science does not happen in a bubble outside of the institutional realities of the world, we have to start having our maps, papers and analyses center people in our proceesses.
-
Faith Taylor 5 years ago
I love that you address WHY the class is working on integrating components of social & environmental justice into the CB report card.
I do want to clarify my point made in class. I was referring to how the EJ movement can be co-opted and when we consider EJ we need to think of EJ, but for who? Encampment for house less people have been disbanded and this has been called “environmental justice” for the surrounds community because the streets were the house less were living could then be cleaned and sanitized. So in this sense “justice” was achieved for housed community members but at the cost of the displacing a vulnerable community. So even the EJ movement can be co-opted depending on who is framing what it means for something to be environmental just.
-
Taylor Gedeon 5 years ago
I appreciate that you highlighted how people with diverse backgrounds need to be at the table, and the importance of collaboratively working with impacted communities. Something I think is unfortunately missing from a lot of well-intentioned work that I am glad we are attempting to address in updating the report card.
-
Chelsea Richardson 5 years ago
There is a definite need for the engagement of new and diverse stakeholders. Diverse stakeholder engagement is important to accomplish meaningful outcomes!
-
Megan 5 years ago
Great job summarizing a complicated conversation in class. Tracking the process of how we get to these final products will be the most important outcome of our class, in my opinion.
-
Katrina Kelly 5 years ago
I appreciate your distillation of the core concepts we covered. Bill has mentioned often how clear language about indicators is what helps to make them effective. The example you shared of big data mapping is an exciting way to reach a wider audience of understanding. Environmental justice is such a broad and dense topic that visualization of these multilayered and interconnected issues may be the most efficient and unconvoluted way to let the data speak so that nearly anyone can "hear" what it's saying.
-
Amanda Rockler 5 years ago
You make a case for who should be at the table and the importance of effective communication and I can’t agree enough! Stephanie Evergreen https://stephanieevergreen.com/ was one of Dr Pines invited “grand challenge” speakers this year and her talk on good communication was great. https://youtu.be/bfNS2sN6gtM
-
Olivia Wolford 5 years ago
This post did an excellent job of summarizing class events, as well as reiterating the need for collaborative work with marginalized communities themselves. I also really enjoyed seeing a visual from your own research!
-
Jehnae Linkins 5 years ago
This was an interesting read, I love how you were able to translate the class conversation. It is important to be able to follow the paper trail and see the progress and process to getting to these end products. Using your own research as a visual helped bring your point full circle.
-
Sarah 5 years ago
As a reflection of where we were in the course to now, it is amazing how far we have come with our indicators! We now have around 20 indicators that we have highlighted and provided brief overviews on as well as possible data sources that can be used. Most of the indicators we highlighted are within your blog post from about two months ago, which is exciting that we were able to stick with the majority of them. A great blog post that enhances the progress that we made this semester! :)
-
Imani Black 5 years ago
You were spot on when you said, "Sadly, this information is being overlooked and/or undervalued by people who can turn this information into action. We cannot overlook the harsh realities of environmental justice." It will never be easy to talk about race but it's so important and needed. Once we get to the root of the issue then we will start seeing some real change but we have to be willing to move through that process with compassion and empathy of all involved. Great blog! I loved reading your thoughts!
-
Peter 5 years ago
Looking at these discussion now, you will find that it accurately predicts our progress. Mapping is also used in various places, such as stakeholder, to visualize from macro.
-
Ashley Silver 5 years ago
I agree, the data that is collected and mapped is being undervalued because some of the environmental issues we addressed in class are not represented well when establishing policies.
-
Shakira 5 years ago
Isabel, as you stated in your very last paragraph, "While we can make all the maps we want with these and other sources, if these maps are not put into an appropriate perspective, we lose significance." We have to be willing to do the work, or else mapping wouldn't do much. I think you did a great job showing how mapping can assist with addressing the EJ issues (keyword: assist). It was also great to follow along with what was done in this class, which seems so long ago.
-
Nylah McClain 5 years ago
Reading other blogs and rethinking our class discussions, it really does seem like many of the lackings of the environmental justice movement come from not wanting to unpack more “nasty” parts of history.
-
Imani Wilburn 5 years ago
I love your highlight of how things are today. Not only do you recognize the challenges certain communities face, but you also highlight how even with the data today, this is still an overlooked issue. That is a very important point to make when it comes to environmental justice. I personally have encountered a lack of data, but hearing the data is there but not being used or acknowledged is a very crucial point to make.