Turning the report card spotlight back on ourselves: The first Integration and Application Network report card
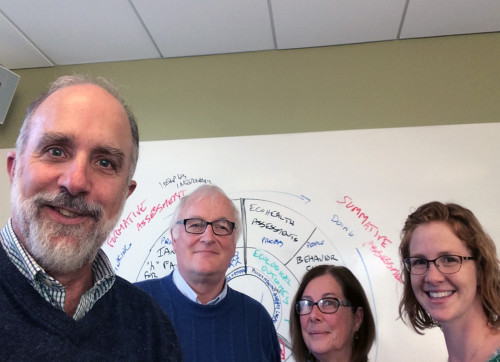
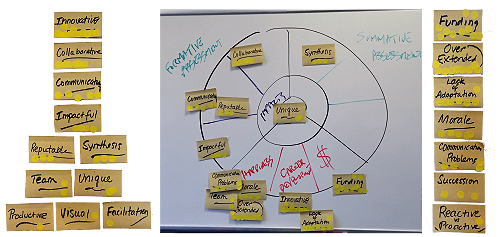
Bill Dennison · | Environmental Report Cards |Our Integration and Application Network (IAN) team has been traveling the globe to help various partners develop rigorous report cards. When we starting working with Tina Bishop and Peter Tuddenham from the College of Exploration to develop an evaluation approach for IAN, we realized that using the same process to develop report cards for our own assessment would be a useful way to evaluate ourselves. So we developed a process to a) conceptualize our values and threats, b) select indicators, c) establish thresholds, d) calculate scores and now, with the publication of the report card on IAN Press, e) communicate our results. Jamie Testa took the lead in producing the IAN report card, but she entrained the entire IAN staff in the production of the IAN report card. This was a collective effort, aided throughout the process by Tina and Peter.
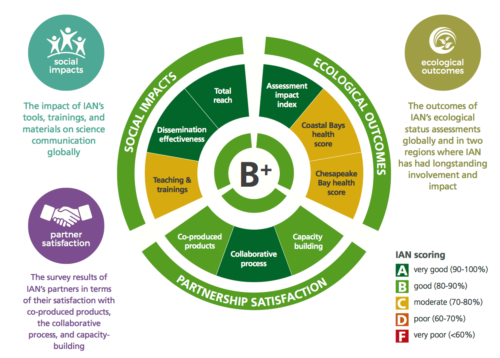
This first IAN report card includes three categories of indicators: partnership satisfaction, social impacts and ecological outcomes. For partnership satisfaction, we devised a survey and asked our partners a battery of questions about their satisfaction with the co-production of products, the collaborative process and capacity-building within their organization. For social impacts, we assessed our media reach, our dissemination effectiveness, and our teaching and training. For ecological outcomes, we used the outcomes of our global assessments, and the report cards scores of two regions where IAN has long standing involvement and impact, the Chesapeake Bay and Maryland Coastal Bays.
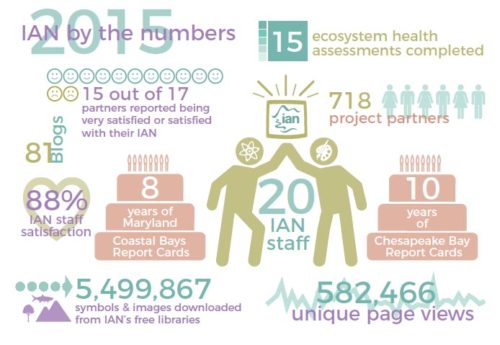
For our initial report card, we used data from 2015. We began this project in early 2016, when 2015 data were available. We anticipate that we can streamline report card production and produce the 2016 report card more quickly. But we also anticipate improving the report card as we refine the indicators and thresholds.
In many respects, the IAN report card process was incredibly useful. We have been forced to rigorously evaluate our values, determine what is important for us and for our partners, and develop strategies to improve our effectiveness. The partnership survey provided important feedback on what we need to work on to become more valued partners. We have instituted practices to better track our activities for evaluation purposes and have developed a first cut at quantifiable goals. But we are not completely satisfied with the indicators that we have used in this initial report card. We believe that we can improve our tracking system and develop indicators that better reflect the outcomes we desired, not just the outputs that we generate. So we will work to develop better outcome-oriented indicators for future iterations of report cards.
We are developing an internal-oriented report card to accompany this externally-focused report card. The internal-looking report card will focus on IAN's financial viability, career development and an employee happiness index. We will use the internal-looking report card to help prioritize our annual retreat discussions, and ultimately institute various practices to enhance career development where staff can excel in a stimulating, challenging and fulfilling work environment.
We feel that the combination of outward and inward-oriented report cards will help guide us to be better partners, increase our ability to make an impact that ultimately leads to positive ecological outcomes while maintaining a financially viable and productive team who continue to grow and develop in a fulfilling work environment. But the interactions between the outward and inward-oriented report cards are important as well. The IAN effort needs to be financially viable for job security, with career development and a healthy work-life balance if they are to be effective in developing productive partnerships that result in positive outcomes. Alternatively, making a difference and working with good partners is a key aspect to personal satisfaction with sense of accomplishment. So we view the external and internal report cards as nested within one another and equally important.
One of the reasons we are posting our IAN report card on IAN press is that we anticipate that other groups will find this approach to self evaluation useful. Just as the environmental report cards we have been developing around the world have proliferated, we hope that report cards for institutions and agencies will also proliferate.
About the author
Bill Dennison

Dr. Bill Dennison is a Professor of Marine Science and Vice President for Science Application at the University of Maryland Center for Environmental Science.