Two Guys and a Tinny: Conducting estuarine assessments
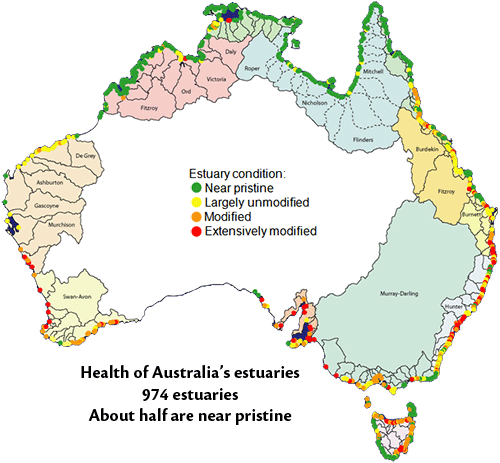
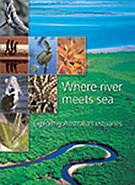
Bill Dennison · | Environmental Report Cards |I had the opportunity to catch up with Steven Walker, the Executive Dean of the newly formed Faculty of Science at the University of Queensland. Years ago, Steven and I worked on an interesting project which was to assess the health of the 1000+ Australian estuaries as part of the National Land and Water Resources Audit. The estuary project was divided into three components, 1) a concept mapping and initial assessment of each estuary (summarized in the book "Where River Meets Sea: Exploring Australia's Estuaries", Turner et al., 2004), 2) an online version of estuarine descriptions, remote sensing, and habitat mapping (culminating in the Ozcoasts website, maintained by the Geoscience Australia) and 3) a suite of estuarine models which provided a first approximation of estuarine condition and assessment, resulting in the Simple Estuarine Response Model (which Steven Walker and John Parslow at CSIRO developed).

While these models, website and book were worthwhile outputs from this project, there were several of us that considered an alternative approach which we called "Two guys in a tinny". The concept was that we had about a year and a half to conduct this continental scale assessment of estuaries and about a million dollars. Instead of having a series of meetings and accumulating data of the 50 or so estuaries that actually had data, we should send two guys (or gals) off with a map, a good four wheel drive vehicle trailering a small boat that could be launched quickly and easily (the Aussie word for small boat was a 'tinny', referring to the aluminum material used for construction). This field crew would launch their tinny and be tasked with collecting a limited set of data, which combined with remote sensing and various maps would be used to develop a limited, but novel data set for each estuary. The 'two guys in a tinny' concept proved attractive to individuals (everyone volunteered to be one of the two guys, including me), but the bureaucratic elements took over and this option was not pursued. I think that it just sounded like too much fun to be taken seriously.
I found the exercise of approaching the issue of a one-off or single time sampling that could last just a few hours for any one estuary to be interesting. We had a diverse group of scientists contemplating the issue and each discipline came up with different priorities. The geologists wanted maps of the different sediment facies, the geologic features like sand, mud, dunes, or deep water, for example, that comprised each estuary. The biologists wanted maps of habitats, like mangroves, salt marshes, seagrass, soft bottom, etc. which often corresponded with the geological facies maps. The chemists wanted a longitudinal transect of the estuary with salinity and nutrients to investigate whether the relationship was linear (conservative) or non-linear (non-conservative). The physicists wanted a measure of residence time, which the models would be able to generate if a reasonable water depth profile could be obtained (most small estuaries in Australia had little or no water depth data). So each of these disciplines had different priorities, but taken in combination, a reasonably comprehensive assessment could be performed with a limited set of observations.
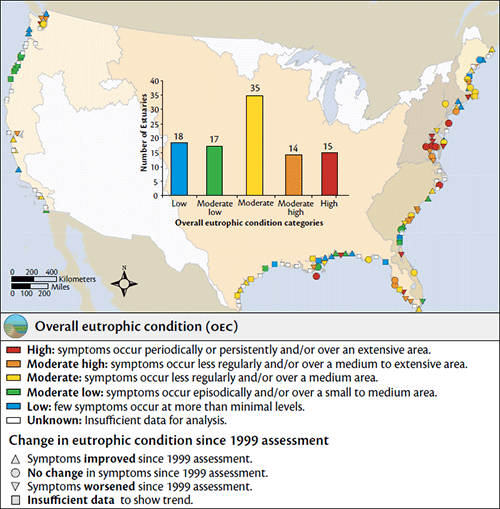
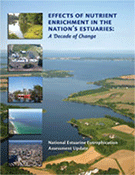
Later, I was again confronted with the task of doing a large-scale estuarine assessment in the US, again resulting in a large report (Effects of nutrient enrichment in the Nation's estuaries: A decade of change) and website, and again the approach of actually collecting original data was discounted. The result of the national syntheses is that a few well-characterized estuaries, which typically coincide with regions that are heavily populated, are over-represented and the smaller and remote estuaries are largely ignored. Sending people off for a rapid assessment does have issues of temporal variability, but there are some ways to account for this variability. For example, coupling the assessments with time series of remote sensing images, having some sentinel sites in representative estuaries with temporal assessments, flow normalizing the data, and using time integrating features like habitats and sediment facies. When the time comes again for a national assessment, we really need to think hard about whether or not new data collection is warranted. Some version of "Two guys in a tinny" may be in order.

About the author
Bill Dennison

Dr. Bill Dennison is a Professor of Marine Science and Vice President for Science Application at the University of Maryland Center for Environmental Science.

