Water supply is a concern in report card planning for the Missouri River Basin
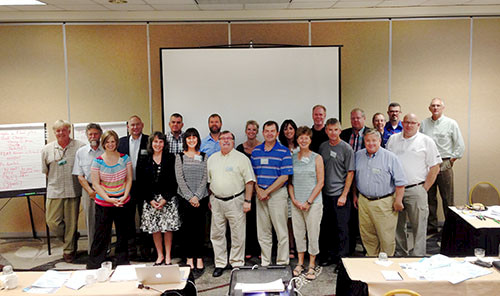
Heath Kelsey · | Environmental Report Cards | Science Communication |I traveled to Kansas City, Missouri August 26, 2014 to facilitate a workshop in the Missouri River Basin, as part of the Mississippi River Report Card project with America’s Watershed Initiative. This meeting, held at the Kansas City Airport Hilton, was a follow-up to the May 23 meeting we had in Rapid City, South Dakota, where we got a good start on conceptualizing issues and concerns in the basin. Most of the participants at the first meeting were from the upper Missouri River region, and this additional meeting was necessary for the perspectives from stakeholders in the lower region.

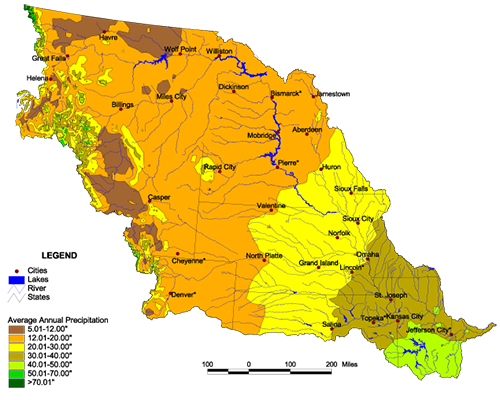
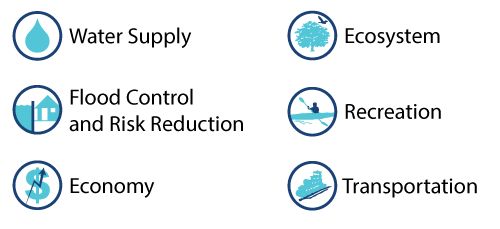
The topic of water supply goal generated the most discussion, as it is arguably the most contentious issue in the region. Water supply is one of six goals that guide the development of the report card. The southeast portion of the Missouri River basin, includes parts of Missouri, Kansas, Nebraska, and Iowa, and it gets much more rainfall on average than the northern and western portions, with the exception of snowfall in the extreme western region. This disparity leads to differences in distribution and allocation of water resources. Water supply issues are further complicated by legal and historical precedents – I plan to address “western water law” in a future blog.

Indicators that were discussed for the Water Supply goal in the Missouri River included measures of water shortages or impacts from these shortages. We include “Water Stress,” which is a measure of overall demand vs available supply as one of our core indicators, but it was suggested that the numbers of shortages related to any water use could be a useful tool to evaluate differences in the region; these shortages could also be viewed in terms of their economic impact. Other specific suggestions included “bed degradation,” which refers to a lowering of the elevation (or “grade”) of the riverbed, which can cause water intake and discharge infrastructure problems, and aquifer contamination, as an emerging issue.
During the previous workshops in the Upper Mississippi, Ohio, Lower Mississippi, Arkansas/Red River basins, we found similarity in many of the indicators that were recommended for the six America’s Watershed Initiative goals. In keeping with the report card theme, we refer to these as "core" indicators, while "elective" indicators may be useful for individual basins. In general, there seemed to be agreement that the core indicators would work fairly well for the Missouri basin, but with a few exceptions/additions. In connection with Flood Control, we discussed the possibility of evaluating the cost of floods that were averted by flood control structures as a potential indicator. For Economy, we discussed the difficulty of finding economic metrics that reflect on the status of regional economies and that reflect the linkages to water resource management. In Ecosystems we revisited the utility of "bottomland hardwood" as an indicator, with the decision that "wetlands" from the National Wetlands Inventory would be a more useful indicator, as it reflects habitat quality and quantity in all of the basins. We also discussed birds, fish passage, and sedimentation as potentially important indicators. For the Recreation goal, including key access and public water trails was discussed as important additions. And finally, for the Transportation goal, we discussed using total cost of goods transported, (instead of tonnage as is currently used), and port related investments. The value of the river as a cost-effective transportation option with excess capacity was also emphasized.

In all of our meetings throughout this project, participants have voiced unique and interesting ideas on indicators and issues. Unfortunately many of them can’t be realized in this first generation of the Mississippi River Report Card. Many of these suggestions have come up repeatedly in other workshops, and are good ideas, but can’t be included for one of several reasons, most often because we can’t readily access the necessary data. However, even though these indicators might not make it into the current report card version, the discussions about them could have a lasting impact on the future direction of this report card project. I call this the “Here are the data we have, and here are the data that we wish we had,” discussion, but it’s really just about data gaps. By highlighting these gaps, we can make recommendations to data collection and analyses that, if available, would present a clearer picture of goal status.

About the author
Heath Kelsey

Heath Kelsey has been with IAN since 2009, as a Science Integrator, Program Manager, and as Director since 2019. His work focuses on helping communities become more engaged in socio-environmental decision making. He has over 15-years of experience in stakeholder engagement, environmental and public health assessment, indicator development, and science communication. He has led numerous ecosystem health and socio-environmental health report card projects globally, in Australia, India, the South Pacific, Africa, and throughout the US. Dr. Kelsey received his MSPH (2000) and PhD (2006) from The University of South Carolina Arnold School of Public Health. He is a graduate of St Mary’s College of Maryland (1988), and was a Peace Corps Volunteer in Papua New Guinea from 1995-1998.