Welcome to Rio! The Guanabara Bay first stakeholder workshop
Alexandra Fries · | Environmental Report Cards |Rio de Janeiro is a Brazilian State with vibrant cities (including the one with the same name) along the shore of Guanabara Bay and the Atlantic Ocean. Guanabara Bay is highly impacted system due to a large population leading to sewage and trash pollution. The State of Rio and State of Maryland have a partnership of learning between their similar bays, Guanabara Bay and Chesapeake Bay, in order to promote opportunities for restoration to achieve economic, social, and environmental benefits. As a part of this partnership, UMCES, KCI, and PSAM (Environmental Sanitation Program of the municipalities surrounding the Guanabara Bay), with support from the Inter-American Development Bank, are working to develop the first report card for Guanabara Bay.
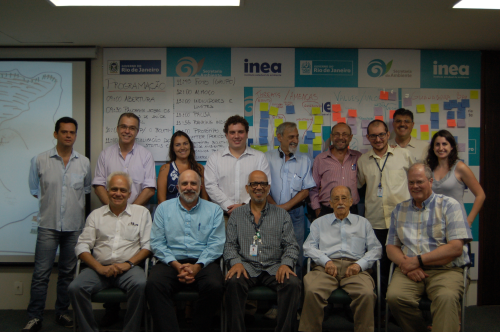
On April 25th 2016, Bill Dennison, Dave Nemazie, and I held the first report card stakeholder workshop at INEA (Instituto Estadual do Ambiente) in Rio de Janeiro, Brazil. Our colleagues from KCI Technologies, Inc.; Bob Summers and Joao Coimbra also assisted in the workshop. The workshop was hosted by Marcio Santarosa and Guido Gelli, two key partners we are working with, from PSAM. This first stakeholder workshop brought together about twenty people from a number of organizations.
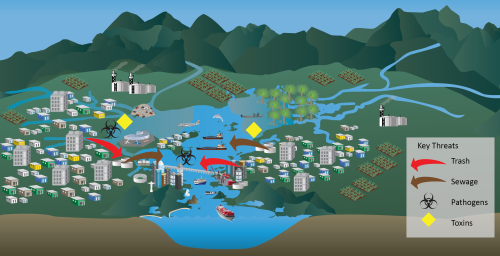
During the meeting we went over the report card process, including covering steps 1 – 3 as a group. We conceptualized the system using maps to show areas of the key values and threats. All of the maps were combined into a conceptual diagram of the Bay and it’s basins.
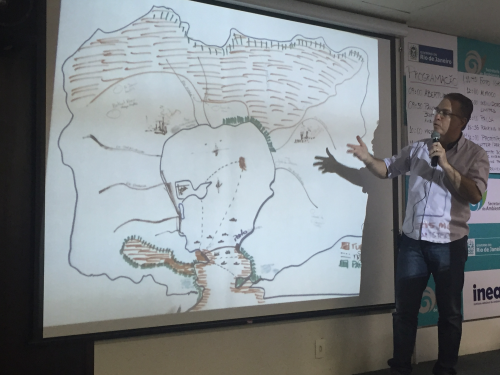
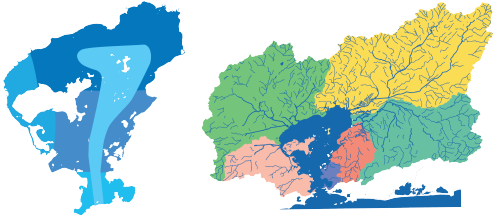
We worked on separating both the Bay and the basins surrounding it into reporting regions for the report card. Working as a group, we came up with five regions in the bay and six basins in the watershed.
We discussed indicators to include in the report card and came up with many interesting indicators. In addition to more standard water quality indicators, additional indicators being considered include sea horses, marine mammals, and the level of contamination of crabs.
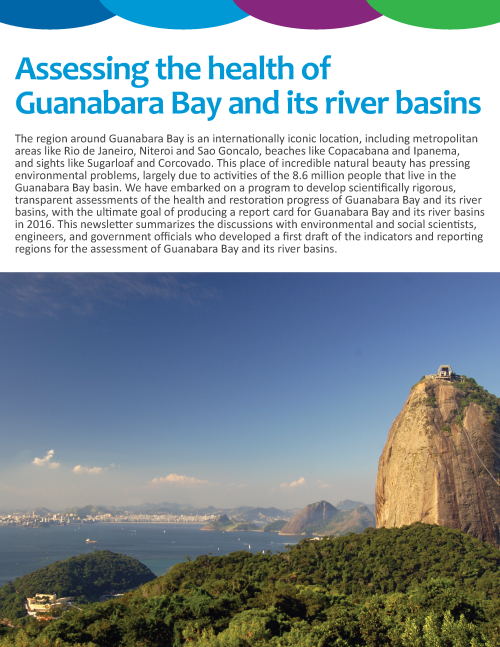
The results of this initial workshop were compiled into a newsletter, which we had reviewed by the group and printed in time for our large meeting on Friday April 29th at the Museum of Tomorrow. The newsletter is available for download in both English and Portuguese on our IAN Press site.
Overall, the targeted session was extremely successful, and further work with a group of stakeholders will inform the final Guanabara Bay report card.
About the author
Alexandra Fries
Alexandra is a Program Manager at the Integration and Application Network (IAN) based at the University of Maryland Center for Environmental Science in Annapolis MD. Alexandra’s work in environmental management has been focused on assessment, monitoring, and management of aquatic, marine, and terrestrial ecosystems. Alexandra has extensive experience in data analysis, synthesis, mapping, interpretation, and communication. Alexandra has experience working with a diverse group of partners including those in local, state, and federal government, non-governmental organizations, non-profit organizations, private industry, and academia. Within IAN, Alexandra conducts data analysis, synthesis, and communication by completing environmental report cards, updating the IAN website, and conducting science communication courses. Alexandra also creates science communication materials such as diagrams, posters, presentations, newsletters, and reports using Adobe Creative Suite, Microsoft Office Suite, and ArcGIS. Alexandra has experience managing projects and staff on local and international projects, liaising directly with partners and colleagues, and providing insights on project direction and goals.