The praxis of science visualization
Bill Dennison ·The Integration and Application Network (IAN) staff recently completed teaching a new course in Science Visualization. This course was part of the Marine-Estuarine-Environmental Science (MEES) Program through the University System of Maryland. Praxis, the word that Aristotle used to mean "thoughtful, practical doing", refers to the emphasis that this course had on developing the practical skills of science visualization. Students were trained to become aware of the key elements of design and layout so that they could analyze and interpret the elements of graphs, photos, maps and diagrams that worked well or not so well and, importantly, understand why they worked or didn't work.
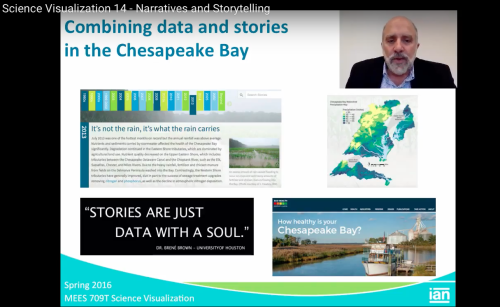
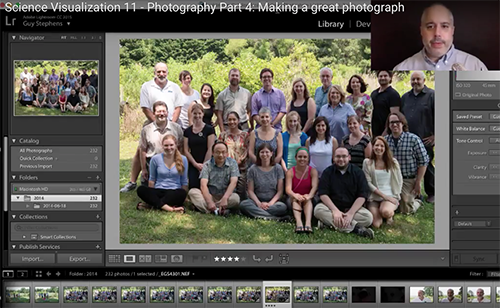
There were several things that distinguished this course from other graduate courses. First, it was taught using a "flipped" or "inverted" classroom in which the lecture content was provided prior to the class time via YouTube videos. The class time period was used for discussion and review of student project work. Second, an unusually high number of instructors provided content and review for the students. While the course was nominally taught by me, ably assisted by our Teaching Assistant Vanessa Vargas, a large number of IAN staff contributed. Brianne Walsh led the conceptual diagram module, Jane Thomas led the data visualization and Adobe Illustrator module, Caroline Donovan and Heath Kelsey partnered for the mapping module, Guy Stephens, Jane Hawkey and Dylan Taillie partnered for the photography and videography module, Alex Fries led the story boarding and Adobe In Design module, Guy Stephens led the web design module, Jane Hawkey led the presentation module. Bill Nuttle contributed to the review process and Randy Olson joined a class to help with the narrative structure exercise. We used GoToMeeting, which allowed us to participate from anywhere that we had an Internet connection. This meant that I did not miss any of the classes, even though I was in Cambridge or Annapolis (Maryland), Texas and Rio de Janeiro.
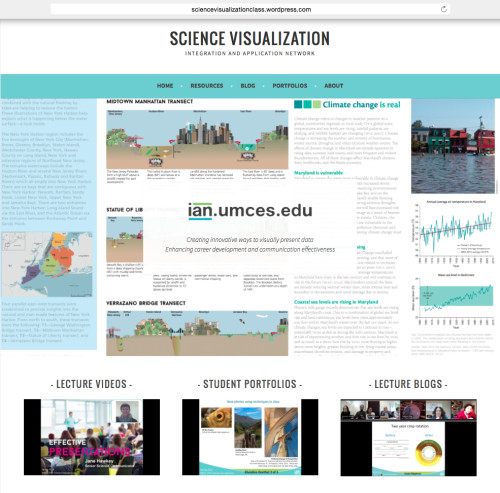
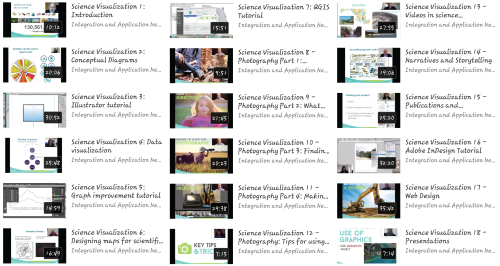
Another unique aspect of this course was the publicly available materials produced over the course of the semester. Each student took a turn summarizing the discussions into insightful and interesting blog posts. The blogs and the comments they generated were helped capture the learnings and share science visualization experiences. The eighteen video lectures and tutorials were posted on the IAN YouTube channel as they were produced. And to wrap things up at the end of the semester, Vanessa Vargas used her newfound web skills to create a course website (sciencevisualizationclass.wordpress.com) in which all of the videos, blogs and student portfolios are available.
Randy Olson had a short but impactful contribution to the course, as we reviewed the students' ...and...but...therefore... statements. Randy immediately drilled into the essence of what the student was trying to communicate.
Students gained practical experience in a variety of computer programs and web applications (e.g., Adobe Illustrator, Adobe InDesign, Lightroom, QGIS) using their thesis data, images and materials. The course did not emphasize readings or books about science visualization or science communication in general, apart from Randy Olson's new book "Houston, we have a narrative".
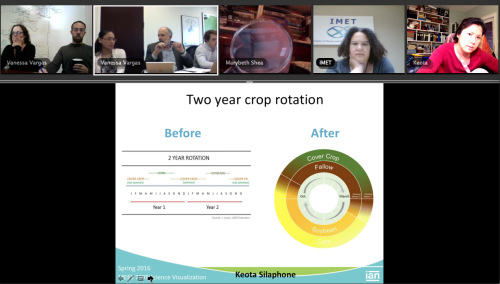
I particularly enjoyed this course for several reasons. One interesting aspect of the course was the wide range in experience and diversity of students. We had an English Professor from the University of Maryland College Park (Mary Beth Shea), a Geography Instructor from Salisbury University (Keota Silaphone), and occasionally a Marine Science Professor from the Institute of Marine and Environmental Technology, part of the University of Maryland Center for Environmental Science (UMCES) (Rose Jagus) participated. The Executive Director of a Washington D.C. based NGO (Caron Gala) participated. A postdoctoral researcher at the Institute of Marine and Environmental Technology, UMCES (Kate Gillespie) actively participated.
We had graduate students from a variety of different institutions: University of Maryland Eastern Shore (Wilmelie Cruz Marrero, Noelle Olson), Appalachian Laboratory, UMCES (Juliet Nagel), Chesapeake Biological Laboratory, UMCES (Christina Goethel). A research assistant from Appalachian Laboratory, UMCES (Kara Hawkins) also participated. We also had two young Science Communication interns (Ben Wahle and Dylan Taillie). This wide range of experience in the class was something that I found unique and stimulating.
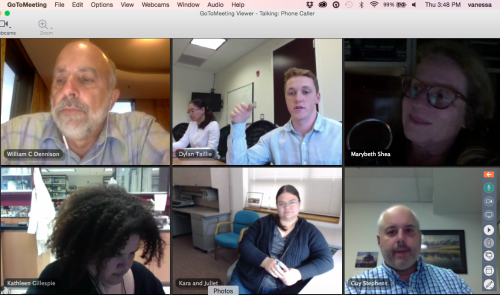
Another reason that I enjoyed the class is that I learned so much. The various modules that the IAN staff pulled together were very informative. Having them posted as YouTube videos provides a fantastic resource, insuring that I can review them in the future when I need a refresher.
I really enjoyed the interactions with the students and feel as though I learned a lot about them and about their research. Even though the course contact was virtual, we had great discussions and reading their blogs and blog comments was something I looked forward to every week. One of the blog comments stimulated us to create a science visualization discussion forum, which we will use to maintain our "science visualization circles" in the future.
We plan to offer this course again, but perhaps our next offering will not be to graduate students, rather tailored to our various partners in the NGO community and various agency people we work with. The format of open access course materials and practical hands-on experience should serve this group of people well. We will post our future course offerings on the IAN website.
To commemorate our course, I wrote the following poem:
Developing an eye for visualizing science
5 May 2016
Weekly virtual gatherings to share science visualizations
With professors, graduate students and interns sharing
Aspiring to effective science communications
Making sure to express our environmental caring.
We learned about bats, proteins in zebra fish and poultry house emission
Roadside turf grass, Arctic clams, and ocean wind farms
Conowingo dam sediments, Mississippi River water quality and Jonah crab reproduction
And ecosystem services and runoff from Choptank farms.
We had great input from Guy, Brianne, Caroline, Alex, Jane,
Dylan, Heath, Randy and Jano
While Vanessa attempted to keep Bill in line
Joining classes from Maryland, Texas, and Rio de Janeiro
Amazingly, the technology all worked out fine.
Randy Olson shared his And, But, Therefore template
Helping us tell science stories more effectively
Getting to the point without making anyone wait
So that we could assemble good stories visually.
We had amazing blog entries and interesting discussions
Jewels in tiaras, image literacy, making not taking a photograph
Smearing papers onto posters, maps as promising explorations
Many of the comments really made me laugh.
The semester went by way too fast
As we learned new concepts and had computer lessons
So we came up with a way to make it last
By creating regular visualization sessions.
Viewing the final diagrams, maps, graphs and photos
Made me realize that the focus on implementation
Was well placed as I saw in the students portfolios
Showcasing some excellent science visualization.
About the author
Bill Dennison
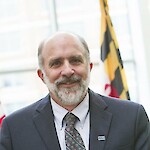
Dr. Bill Dennison is a Professor of Marine Science and Vice President for Science Application at the University of Maryland Center for Environmental Science.
Next Post > Talking report cards in Kratie, Cambodia
Comments
-
Keota Silaphone 9 years ago
Bill,
Thank you for bringing the science communicator out of me! I knew it was inside of me, but I needed the jump-start and this course certainly provided that much needed charge.
There are few graduate courses that are based on hands-on learning and immediate constructive feedback, and I know of no other course that offers the flipped classroom approach. Although traditional peer reviewed literature about effective science communication was supposed to be introduced throughout the semester, I'm certainly glad you went with the flow and followed the practical hands-on approach. For this topic specifically, the flipped classroom approach worked because we could spend designated class time receiving and providing constructive feedback. We learned from each other's science visualization efforts, and you know what? Learning by doing for this topic makes so much sense.
You challenged us weekly to take the concepts introduced in the presentations prepared by IAN staff and this kept my creative side flowing. I was certainly forced to think outside of my comfort zone and see the world from different perspectives.
This course brought a group of us together who all wanted the same thing - to become better science communicators. With this common goal, each of us welcomed the invaluable constructive feedback and the much needed fresh pair of eyes from experienced science communicators. These elements helped all of us become better science communicators in the end (sadly, there is an end to this course).
Thanks again for putting a course designed like this together because it just made a whole lot of sense.
Cheers!
Keota

