What’s the Story in Your Report Card?
Jodie Mehrtens ·story. Since we first learned to communicate, humans have shared our hopes, dreams, fears, knowledge, experiences, and values through story. We share stories every day, on our radios and televisions, over the Internet, and at the movies. Stories have the power to draw like-minded people together.
Take an Avengers movies for example. People with different backgrounds and life experiences come together to share their love of watching men in tights save the world. In a not-so-different way, report cards use a mix of pictures and text to tell the story of a catchment (watershed); report cards bring different stakeholders together to share a story (which is hopefully not about men in tights).
When developing a report card, asking the following five questions can help groups to identify and share their story:
1. What story does your report card tell?
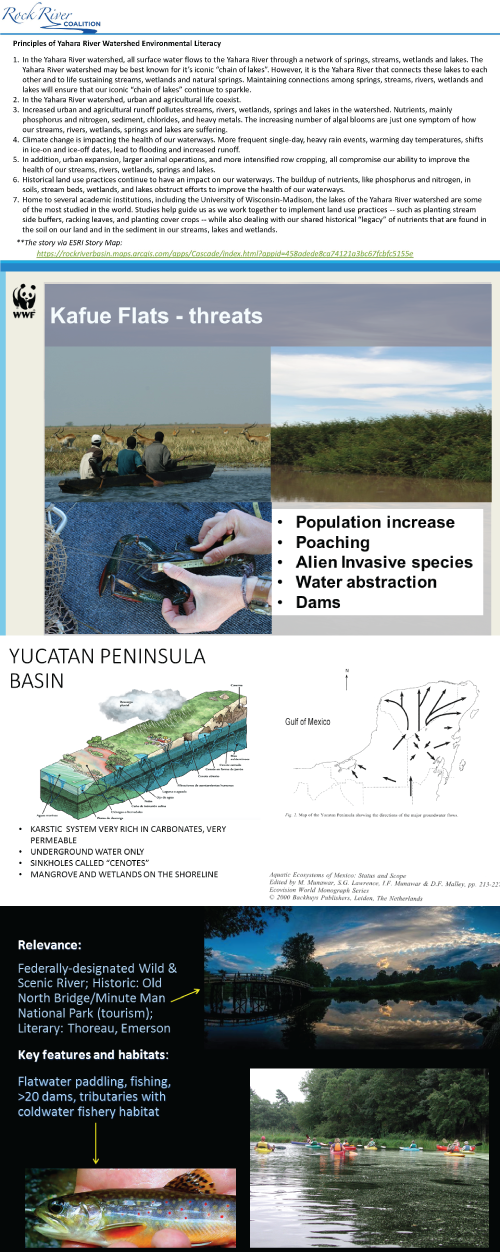
Last week the Healthy Rivers for All course attendees spoke about environmental literacy. Essentially, we were talking about what makes a place special. What is the story of a place? And how do you build an effective story that stays true to the values that make your place special?
2. Who are heroes and villains in your story?
Our class discussed how to identify the values (heroes) and threats (villains) important to a catchment story using techniques such as the SNAP process; which was described in Nancy’s blog post last week.
3. What is the genre of your story?
What kind of story are you telling with your report card? Why are you telling your story? Do you want to affect change in the catchment? Are you reporting on the progress towards target goals? Do you want to educate your community on a particular topic?
Capturing the why of report cards is integral to the success in creating your vision, and focusing your objectives. The why of your story will keep you on track for when you choose your conceptual framework.
4. How is your story structured?
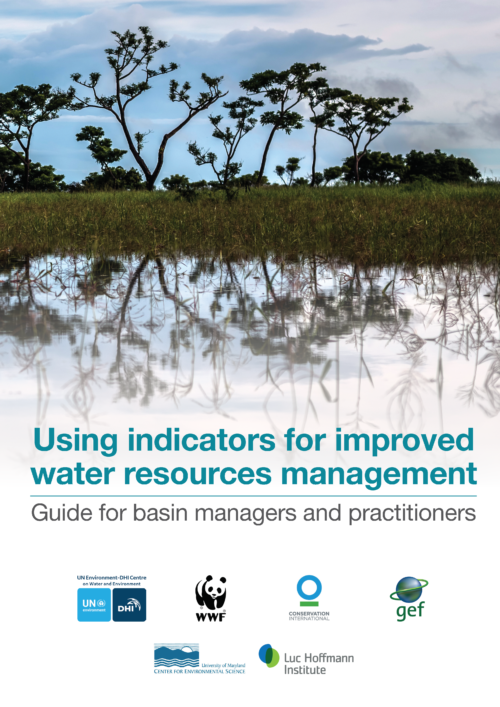
There are a number of conceptual frameworks you could use to structure your report card story. The Guide for basin managers and practitioners outlines some of the more popular frameworks, along with their strengths and weaknesses. Here, it is worth mentioning that when you choose a framework, you will rarely make progress without having a “robust” discussion around which framework is best and what each of the components of the framework mean. Whether you’re a fan of the DPSIR (Driving forces – Pressures – State – Impacts – Responses) or the more simplified PSR (Pressures – State – Responses) model, choosing an appropriate framework is important. Through our class discussion, we agreed that the framework needs to be fit for your specific purpose, be clear and flexible, and be reflective of the core values and goals of your report card program. A clear and purposeful framework is like good plot, keeping your heroes winning and your villains in check!
5. Who are the main characters in your story?
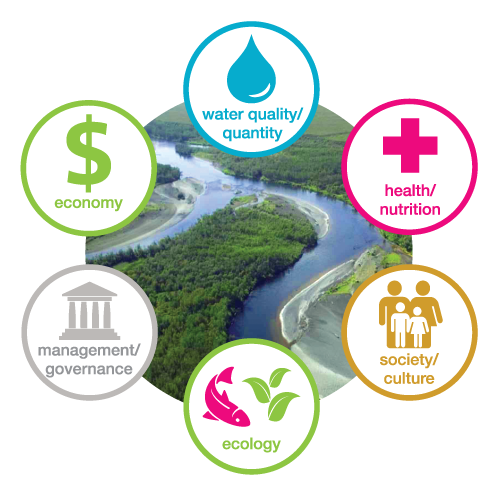
The categories of river basin health that you choose to measure against are going to be your cast of characters. The indicators will let you know how your characters (categories) are performing.
The key to choosing indicators is to be inclusive and flexible. Consider ideal and realistic options. Through a collaborative engagement process you can end up with a long list of potential indicators to report against your categories. In the end, your stakeholders may come up with as many as 60 to 100 indicators. So how do you navigate this “jungle of indicators”?
The most popular criteria to assess your indicators against is the SMART criteria (outlined In the Practitioners Guide and the Guide for Basin Managers and Practitioners):
- Sensitive
- Measureable
- Available
- Relevant
- Thresholds
I know what you’re thinking, these traits sound ideal for a leading man! True! But seriously, they are also excellent guiding factors for filtering your jungle of indicators into a nice, orderly garden. For a full explanation of the SMART indicator assessment criteria, and also CREAM and SPICED criteria see pages 14-21 of the Guide for Basin Managers and Practitioners.
There are an ideal number of indicators (between ~5 and 13) to include in a report card. Too few indicators may result in single indicators driving the score, while too many can result in a loss of sensitivity to detect real change in the environment. The right choices may come about through trial and error until you find a set that suits your needs. Don’t forget to highlight indicators that you might want to include in the future. Be flexible and find a balance between indicators that can reflect both long-term and short-term goals.

It’s important to know when it is time to let go of indicators that are no longer working for you. Sometimes indicators become irrelevant because the problem has been solved, and/or you have recorded its progress through to completion.
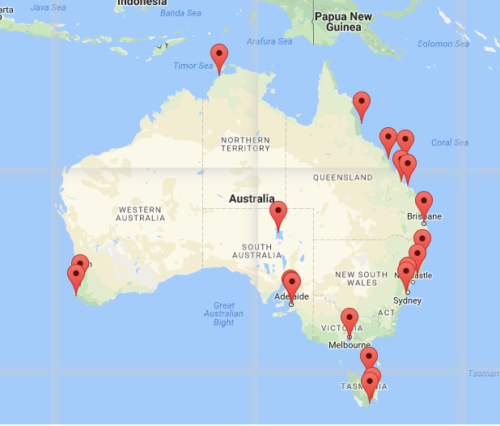
If you are just starting out on the report card journey and you are constrained by limited data availability, you may have to accept what is available rather that what is ideal. Whatever the situation, it is important to be transparent about the indicator selection process, and beyond. There’s a wealth of learning and information out there to help you navigate all the ups and downs of creating a report card for river health. Reach out to your network of peers, or create a network of peers to discuss and share experiences. In Australia there are lots of report cards, and the National Report Card Network allows everyone to help each other navigate the trickier aspects of report cards. We share knowledge at annual meetings and teleconferences and collaborate where possible.
Ultimately, the right way to develop a report card is the way that works best for your stakeholders, while also having the most impact!
Next Post > Coastal and Estuarine Research Federation 2017 Conference
Comments
-
Alison 8 years ago
This is great and really helps me think through the difference between how technical people/scientists (like us) think and how the broad range of stakeholders/public may think, and how to bridge that communications divide. Analogies, narratives, will be very specific to the place and time, but I find the challenge useful. I'm still pondering how to develop the story for both short-term and long-term goals.
Thanks!
-
Irina 8 years ago
Very easy to read and colorful Blog! Loved the "heroes in tights" comparison :D Congrats!
-
Katya Altman 8 years ago
Informative and entertaining! Great job, Jodie!
-
Nancy Sheehan 8 years ago
Your blog is super! I was not familiar with either DPSIR or PSA frameworks. You provided the context I needed to better situate the Guide for Basin Managers and Practitioners within the larger context of report card development.
Yes to collaboration! More is needed. Love the idea of a regional network of watershed report cards. Thanks for sharing the link to Australia's National Report Card Network. These networks will help us watch real-life heroes and heroines- not just Hollywood's men in tights!
-
Kennedy 8 years ago
Thanks Jodie for such an informative piece especially considering I didnt attend the last class.
'Ultimately the right way to develop a report card is the best way that works for your stakeholders while also having the most impact' -
Chanda 8 years ago
Nice blog! Really enjoyed reading it and the clarity makes it easy to understand indicator selection and navigation. Most importantly the reminder to do what works in your context and with available data.
-
Ximena Celis 8 years ago
I liked the blog. Really easy to understand. Maybe a list of indicators will be a nice to have, just to know which are the most common to use in a report card.

