Join the Celebration!


Celebrating 100 Years of Science! | 1925-2025

  • UMCES HOME
  • DONATE

Search form

  • Work with Us
    • Science communication services
    • Environmental report card production
    • Training and capacity building
    • Stakeholder Engagement
    • Careers
  • Media Library
    • Symbols
    • Graphics
    • Photos
    • Videos
  • Report cards
  • Education
    • Professional Certificate
    • MEES Graduate Program
    • Short Courses
    • Initiatives
  • Blog
  • Enewsletter
  • Publications
    • Books
    • Report Cards
    • Newsletters
    • Reports
    • Brochures
    • Posters
    • Papers
  • Projects
  • About
    • Who we are
    • What we do
    • Our Mission
    • History
    • Partnerships
    • Contact
    • Land Acknowledgment Statement
    • Project Videos
  • Home
  • Media Library
Clear Filters

Lightbox (0)

Symbol Package
The Niobrara River is where six major biomes converge to form a rich diversity of flora and fauna. Threats to the river arise from fire exclusion leading to the expansion of ponderosa pine into grassland area, changes in microclimates, the spread of invasive plants and the high volume of visitors during peak periods.
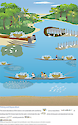
Niobrara National Scenic River Resources and…
A map shows that land use in the Ohio River Basin is dominated by developed, forested and cropland areas. Diagram from
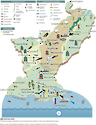
Ohio River Basin Land Use
A conceptual diagram illustrates the dates and locations of different Mississippi River Report Card workshops. The workshop process is used to bring different groups together to strengthen the report card and promote broad prospectives, dialogue and collaboration.
Mississippi River Report Card Workshop Timeline
The diagram lists potential indicators for the Ohio River Basin that were generated at the workshop. The goals listed in this diagram are representative of the things people value in the Ohio River Basin watershed.
Potential Indicators for the Ohio River Basin
The Lower Mississippi River Basin supports a diversity of uses, dependent upon both natural and human engineered systems. This conceptual diagram illustrates the main threats and key features of the river basin.
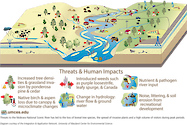
Threats and Features of the Lower Mississippi…
As land use in the Chilika Lake area changes from forest to settlements and paddy agriculture sewage, and fertilizer and pesticides runoff increases into the Lake. This extra nutrient input results in algae blooms that float and sit on the bottom.
Chilika Lake Pollution Pressure
While tourism provides economic benefits to local communities surrounding Chilika Lake, tourist activities can have several negative impacts on the environment including air pollution, trash, noise and wildlife disturbances.
Chilika Lake Tourism Pressure
Lower Mississippi land use is dominated by developed, forested and cropland areas, and has the largest proportion of wetlands of the entire Mississippi River Basin.
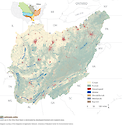
Lower Mississippi Land Cover Map
Several connections were made at the Lower Mississippi River Basin workshops. These connections will be used to develop a basin-wide report card for the watershed.
Lower Mississippi Workshop Connections
The Chesapeake Bay watershed received an above average annual amount of precipitation in 2013. This accompanied degrading conditions in some regions of the Chesapeake Bay watershed and improving conditions in others.
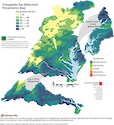
Chesapeake Bay Watershed Percipitation Map 2013
Unsustainable fishing and aquaculture practices have put pressure on the Chilika Lake ecosystem. Dead fish thrown back into the water contaminate the lake while shrimp pens trap sediment and kill juvenile fish.
Chilika Lake Fishing and Aquaculture Pressures
During monsoon season excess sediment is deposited in Chilika Lake, mostly from Mahanadi River tributaries, nearby settlements, and agricultural lands. As the Lake becomes more shallow and its sea outlets fill in with sediment, increased flooding occurs.
Chilika Lake Sedimentation
Improvements in water quality can be counteracted by changes in nutrient sources and land-use practices. Increased nutrient loads from stormwater and intensified agriculture often overwhelm the positive effects of best management practices.
Counteracting Factors Impacting Best Management…
Emergent wetland species are planted in a buoyant matrix that floats at the water surface. The roots of these plants grow through the matrix and take up the nutrients they need to grow directly from the water, potentially decreasing nutrient concentrations.
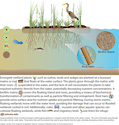
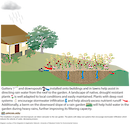
Floating Wetlands Structure and Impact
Excess nutrients will result in increased chlorophyll and turbidity, limiting the amount of light that reaches benthic sediment. Light is essential for healthy submerged aquatic vegetation growth.
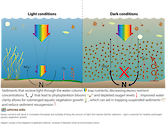
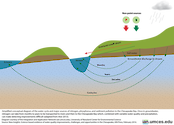
Light and Dark Conditions Impact on Submerged…
Gutters and downspouts installed onto buildings direct rainwater from roofs to rain gardens. Plants with deep root systems encourage stormwater infiltration and absorbs excess nutrient runoff.
Multiple Benefits of Rain Gardens
Coastal wetlands that are protected from erosion have an adequate sediment supply to build upwards, and will likely be more resilient to the effects of climate change.
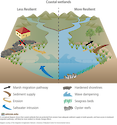
Coastal Wetlands Resilience to Climate Change…
Diagram depicting Human-caused and natural vulnerabilities of Chesapeake Bay to climate impacts.
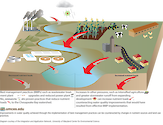
Human-caused and natural vulnerabilities of…
A diagram that details a timeline of the catalytic converter and its functions.
Catalytic Converter Diagram
Simplified conceptual diagram of the water cycle and major sources of nitrogen, phosphorus, and sediment pollution to the Chesapeake Bay.
Groundwater Diagram
A diagram showing that inorganic nitrogen (N) in wet deposition has decreased in the Chesapeake Bay watershed between the periods 1989–1991 and 2001–2009.
Inorganic Nitrogen in Chesapeake Bay Watershed…
A diagram depicting the effect that light conditions have on SAV and the trapping of nutrients.
Nutrient Trapping Diagram
The Chesapeake Bay watershed’s population is growing quickly. The watershed is currently home to 17.5 million people, and this number is projected to reach 20 million by 2030.
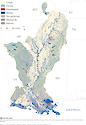
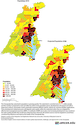
Population Map Chesapeake Bay Watershed
A diagram showing best management practices required to target the numerous sources and delivery pathways of excess nutrient loads.
Targeted Practices Diagram
  • Prev
  • 1
  • 2
  • 3
  • 4
  • 5
  • 6
  • 7
  • 8
  • 9
  • 10
  • …
  • 18
  • Next

UMCES Links

  • Home
  • About
  • Campuses
  • News & Events
  • Directory
  • Employment
  • Research
  • Press Room

Contact Info

2020 Horns Point Rd
Cambridge, MD 21613

410-221-2048

Contact

Enewsletter

Subscribe to our enewsletter

Copyright 2025 UMCES | Privacy/Terms of Use | An Institution of the University System of Maryland