Join the Celebration!


Celebrating 100 Years of Science! | 1925-2025

  • UMCES HOME
  • DONATE

Search form

  • Work with Us
    • Science communication services
    • Environmental report card production
    • Training and capacity building
    • Stakeholder Engagement
    • Careers
  • Media Library
    • Symbols
    • Graphics
    • Photos
    • Videos
  • Report cards
  • Education
    • Professional Certificate
    • MEES Graduate Program
    • Short Courses
    • Initiatives
  • Blog
  • Enewsletter
  • Publications
    • Books
    • Report Cards
    • Newsletters
    • Reports
    • Brochures
    • Posters
    • Papers
  • Projects
  • About
    • Who we are
    • What we do
    • Our Mission
    • History
    • Partnerships
    • Contact
    • Land Acknowledgment Statement
    • Project Videos
  • Home
  • Media Library
Clear Filters

Lightbox (0)

Symbol Package
Conceptual diagram illustrating the sample design in relation with the parameters and instruments while gathering data in a coastal assessment.
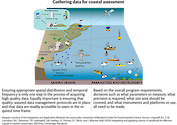
Gathering data for Coastal Assessment
Conceptual diagram illustrating the geographic scale of an environmental report card. The three assessments shown are that of the Chesapeake Bay on a national, regional, and local level.
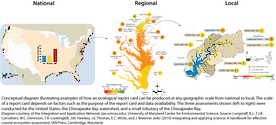
Geographic scaling of report cards
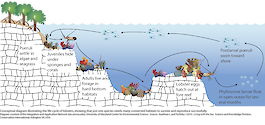
Ideal conditions required for growth of any particular organism vary over scales of time and space. This occurs because the success of a habitat and associated organisms are dependent on a variety of factors. By protecting several replicates of similar habitats in the system, along an environmental gradient, the likelihood increases that at least one habitat will be healthy in any particular year. The life cycle of lobsters shows that just one species needs many connected habitats to survive and reproduce.
Habitat patchwork
A comparison of the current water flow in the Everglades (East to West), versus the historically North-South flow.
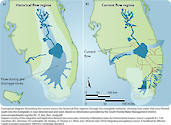
Historical versus current flow regime through the…
Conceptual diagram illustrating how changes in water quality affect different zones of a waterway.
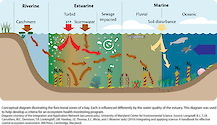
How water quality influences different zones in a…
Conceptual diagram illustrating examples of how indicators and framework are ideally presented in an ecological report card.
Integrating data into an ecological report card
Conceptual diagram illustrating how research, management, and communication successfully come together in creating an ecological forecasting program.
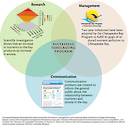
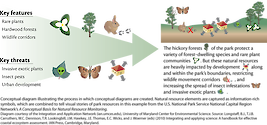
Interconnectivity of research, management and…
Conceptual diagram illustrating the remote sensing process in water quality monitoring. This deals with how light interacts with the remote sensing process.
Light interactions in the remote sensing process
One approach to the development of better coastal and marine policy and management is the concept of marine managed areas (MMAs). A MMA is an area of ocean, or combination of land and ocean, where human activities are managed toward common goals. MMAs are a form of ecosystem-based management, where all elements of a particular system are considered together. When the principles of a marine managed area are fully implemented, the resulting benefits to both the environment and humans can be optimized.
Marine managed areas
Conceptual diagram illustrating the different methods that can be used to monitor water quality from dockside observations, to satellite sensing.
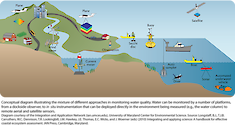
Methods of water quality monitoring
Conceptual diagrams illustrating a few examples of models that can be used to investigate a range of research questions when dealing with data and complexity of the model.
Models of varying complexity
Conceptual diagram illustrating some guidelines in managing a project by informing citizens, and encouraging them to take action.
Producing results in environmental management
Conceptual diagram illustrating the factors that affect the heath of a system, the overall condition of that system, and how the response of society correlates with those aspects.
PSR indicators
Conceptual diagram illustrating the flow of information in a remote sensing toolkit, a web-based instructional procedure. (www.gpm.uq.edu.au/CRSSIS-rstoolkit/)
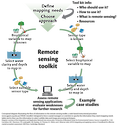
Remote Sensing Toolkit
Conceptual diagram illustrating the sample locations in the Marine Monitoring Network used for the MLR models in the Everglades.
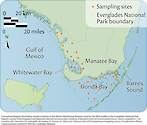
Sampling sites in the everglades
Conceptual Diagram illustrating the necessary collaboration in an environmental campaign.
Science and resource management
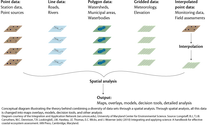
Conceptual diagram illustrating how spatial analysis combines a diversity of data sets into a map, overlay, analysis, and other decision tools.
Spatial analysis
Conceptual diagram illustrating two different methods of measuring a coastal bay. Sixty fixed monitoring stations indicate threshold concentration of nitrogen in the coastal bays.
Spatially fixed sampling
Marine and coastal resources and habitats are used more intensively and thus, are degraded. In addition, global climate change is affects coasts and oceans. Traditional single-sector management is no longer adequate, and governance systems are struggling to keep up with modern technology and practices. In many cases, these conditions have led to unsustainable development. The goal of marine conservation is to address these challenges by promoting sustainable development and resource use.
Sustainable vs. unsustainable development
Conceptual diagram illustrating the 'wedding cake' design for ecological indicators. Used by the National Park Service, this is how indicators are used to make decisions on a national, regional, and local level.
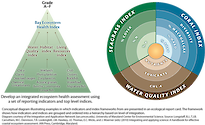
The 'wedding cake' design
Conceptual diagram illustrating how conceptual diagrams are created using information-rich symbols to create a visual story. This example is from the U.S. National Park Service National Capital Region Network's
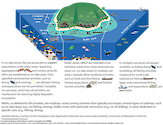
The development of a conceptual diagram
Conceptual diagram illustrating the the continual steps in creating an ecological forecast (forecasting, tracking, assessment, and improvement).
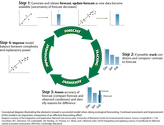
The steps of ecological forecasting
Conceptual Diagram illustrating the approach and how it changes over the time period of a applied science project.
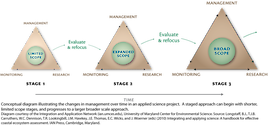
Three stages of environmental management
Conceptual diagram illustrating how societal shifts as far as environment management are powered by a combination of power, knowledge, and passion.
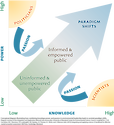
Using knowledge to empower change
  • Prev
  • 1
  • …
  • 9
  • 10
  • 11
  • 12
  • 13
  • 14
  • 15
  • 16
  • 17
  • 18
  • …
  • 28
  • Next

UMCES Links

  • Home
  • About
  • Campuses
  • News & Events
  • Directory
  • Employment
  • Research
  • Press Room

Contact Info

2020 Horns Point Rd
Cambridge, MD 21613

410-221-2048

Contact

Enewsletter

Subscribe to our enewsletter

Copyright 2025 UMCES | Privacy/Terms of Use | An Institution of the University System of Maryland