

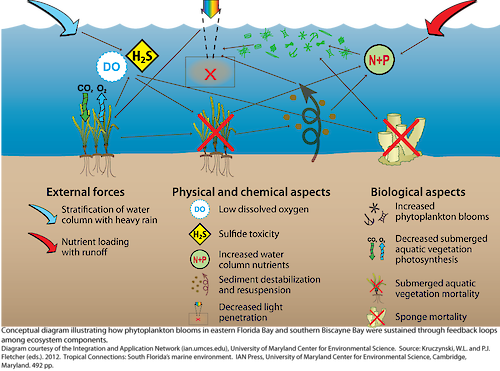
Phytoplankton bloom feedback loops
Conceptual diagram illustrating how phytoplankton blooms in eastern Florida Bay and southern Biscayne Bay were sustained through feedback loops among ecosystem components.
diagram water quality water column stratification nutrient loadings runoff hurricanes light penetration seagrasses submerged aquatic vegetation SAV sponge filter low dissolved oxygen DO sulfide toxicity sediments nitrogen phosphorus| Property | Value |
|---|---|
| Author(s) | Kate Bentsen |
| Author Company | Integration and Application Network |
| Date Created | 2012-01-01 |
| Album | Processes > Biological |
| Type | Graphic |
| Publication | Tropical Connections: South Florida's marine environment |
| Project(s) | South Florida Ecosystem Synthesis |
| Dimensions | 1000 x 742 |
| Filesize | 195.5 kB |
| Number of Downloads | 525 |
| Filetype(s) | PNG |
| License | Attribution-ShareAlike 4.0 International (CC BY-SA 4.0) |
| Required Attribution | Kate Bentsen, Integration and Application Network (ian.umces.edu/media-library) |