A new style of conceptual cross section diagrams developed for New York Harbor
Bill Dennison ·Judy O'Neil led the effort to write a synthesis paper about New York Harbor, as part of the Curriculum and Community Enterprise for Restoration Science (CCERS), a National Science Foundation (NSF) funded project, focused on the expansion of concepts imbedded within the Billion Oyster Project. The paper will contribute to the World Harbour Project.
In developing the synthesis paper across a wide range of issues about New York Harbor with a diversity of co-authors, we struggled to find a way to accurately depict the key processes and major threats. One of the struggles was due to the complexity of waterways, with islands, embayments and rivers running in many different directions. Another aspect that presented a challenge was the complex historical human modifications that have occurred regarding the shoreline development and dredging of the waterways. In addition, New York has constructed iconic engineering works like the bridges, tunnels, and buildings that characterize the region and that people use as geographic benchmarks. So how were we going to be able to depict this complexity on a conceptual diagram, typical of what Science Communicators produce for Integration and Application Network (IAN) products?
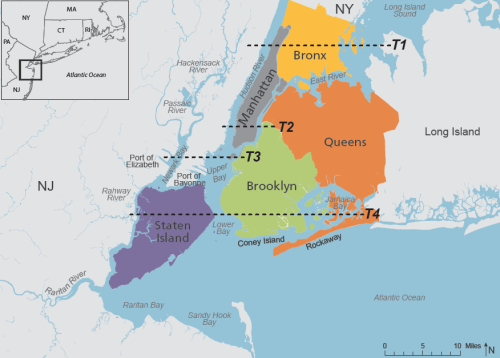
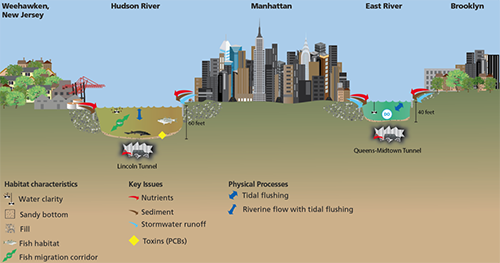
Our solution to this science communication challenge was to develop a series of two-dimensional cross sections of the New York region, providing a cutaway perspective for the typography of land features and hydrography of aquatic features. Brianne Walsh was the Science Communicator on this project. Brianne drew conceptual diagram bases, which were drawn to scale horizontally and scaled vertically using vertical exaggeration. She then populated the bases with symbols to depict the natural and manmade features using the IAN symbol library and by creating a few new symbols. Some of these new symbols are quite iconic, like the Empire State Building, Statue of Liberty and Freedom Tower.
We created four transects in an East-West orientation, extending from New Jersey in the west to Long Island in the east. We needed four transects in this orientation in order to cross through all of the major New York Harbor waterways (e.g., Hudson River, Newark Bay, Arthur Kill, East River, Harlem River, Long Island Sound, Jamaica Bay, Verrazano Narrows) and we deliberately chose to position these transects at iconic locations. For the northern most transects, we chose the George Washington Bridge, the southern most bridge crossing the Hudson River. For the other transects, we chose the Empire State Building on Manhattan Island, the Statue of Liberty on Liberty Island and the Verrazano Narrows Bridge connecting Staten Island with Brooklyn. By choosing these four readily identified locations, we provided easily located points of reference.
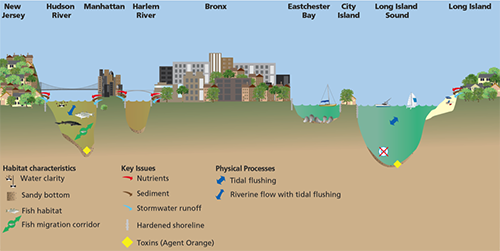
It was necessary to create a simple location map with the transects identified; and this map identified the five New York City boroughs (Manhattan, Bronx, Brooklyn, Queens and Staten Island), as well as the rivers, bays, and surrounding land. We used this map to insure that each of the five boroughs were included in our transects. We insured that this location map included essential maps features, such as a scale, north arrow, and locator inset map.
In the research needed to develop the transect cross sections, we learned interesting things about New York Harbor. We learned about the depth and age of the various tunnels, the heights and ages of buildings and bridges, the historical shoreline features and the variable water depths of the waterways. In showing drafts of the diagrams to various people, they were often surprised at the waterway depths and location of the tunnels underneath the waterways.
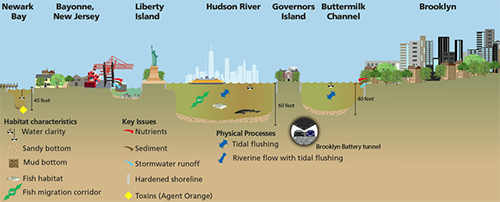
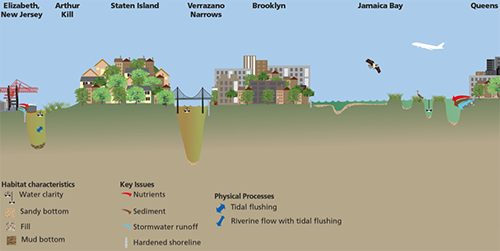
In writing the figure legends for each of the four transects, we began to appreciate the considerable amount of information contained in each diagram. The legends of the transects were 193, 250, 362, and 182 words each. Interestingly, the total number of words in the legends is 987, not far from the adage "A picture is worth a thousand words".
After submitting the paper containing these conceptual cross-section diagrams, we decided that a simplified version of the diagrams could be used in the classrooms of the participating schools. Brianne produced this poster, which included the four diagrams and a location map, which is available on IAN Press.
About the author
Bill Dennison

Dr. Bill Dennison is a Professor of Marine Science and Vice President for Science Application at the University of Maryland Center for Environmental Science.

