A virtual international collaboration producing conceptual diagrams
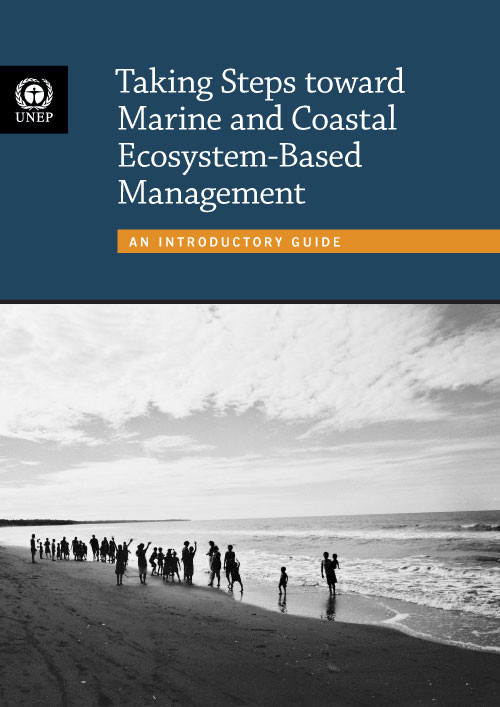
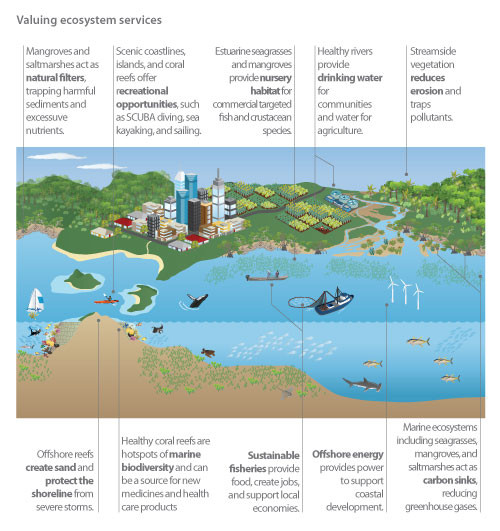
Bill Dennison ·The Integration and Application Network recently conducted an international collaboration with people from different organizations and locations in order to develop conceptual diagrams to be used in a booklet on Ecosystem Based Management (Taking Steps toward Marine and Coastal Ecosystem-Based Management). The project was supported by the United Nations Environment Programme and we had a short timeline to develop conceptual diagrams before it went to print. The people involved did not have the time or budget for a face-to-face meeting. Instead, the project was conducted entirely using emails, file sharing via the IAN website, and meetings conducted via Gotomeeting and Skype.

Over the course of the project, most of the people traveled and one even moved house, yet the project timelines and progress were not impeded. It is a testament to the international workplace created by the Internet that this project was able to deliver on time and on budget.
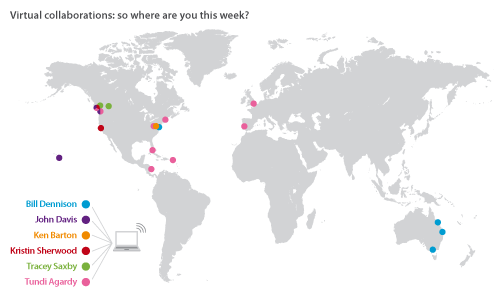
The authors involved in this project were Kristin Sherwood, who lives in Palo Alto, California (USA), John Davis, who lives in Seattle, Washington (USA), and Tundi Agardy who lives in Boston, Massachusetts (USA). The IAN staff member involved in this project was Tracey Saxby who lived in Rossland, British Columbia (Canada) at the beginning of the project and moved to Squamish, British Columbia midway through. I was based in Brisbane, Queensland (Australia) on sabbatical from the University of Maryland Center for Environmental Science (USA). Ken Barton from IAN was also involved in setting the project up, based in Annapolis, Maryland (USA).
Over the course of the project, John traveled to Hawaii (USA) and Victoria BC (Canada), Tundi traveled to the Florida Keys FL (USA), Berkshire Mountains Colrain MA (USA), San Andrés Archipelago (Colombia), St. Thomas (US Virgin Islands), Lisbon (Portugal), London (UK), Washington DC (USA), Seattle WA (USA), and Victoria BC (Canada), and I traveled to Melbourne VIC and Mackay QLD (Australia).

In each case we found an Internet connection, adjusted our time zones and continued our collaborative project. Gotomeeting facilitated screen sharing so we could watch Tracey make modifications in real time, and we also had Tracey post the files on PowerPoint slides and take notes based on our discussion of the draft diagrams. We handled the different time zones by scheduling our sessions in the late afternoon/early evening for the East coast (USA), which corresponded to mid-afternoon West coast (USA) and early morning on the next day (Australia).
An application that I found useful for sketching initial diagram ideas was Noteshelf for iPad. Noteshelf has 17 different colors to choose from and using a stylus, I could sketch a multi-color diagram and email it to Tracey as a PDF file. Tracey used Adobe Illustrator and the IAN symbol libraries to convert these sketches and many of her own creative ideas to generate conceptual diagrams about Ecosystem Based Management.

The virtual collaboration was not seamless, in that we often had trouble hearing Tundi, so she would send instant messages or emails to chime in with her comments, and reduced bandwidth would compromise Tracey's screen sharing. The time zone differences were sometimes complicated when switching time zones or the establishment of daylight savings time in some, but not all, locations. There was a small delay in speaking using Gotomeeting, so we learned to yield to each other and not interrupt to avoid two people talking at once. But in spite of these small issues, the collaboration was intense and productive, as we had a series of focused products that we were producing under a strict timeline.
Using the virtual collaboration, we were able to rapidly evolve the diagrams to the point where all participants were satisfied. Interestingly, the early stages of the genesis of a conceptual diagram was quite frustrating and seemingly unproductive, but then a breakthrough inevitably took place and all of a sudden we were happy with the approach and then only had to tweak the diagrams for finalization. Part of this process was facilitated by Tracey, who used the manuscript and the conversations that we had once or twice a week to interpret the key messages and then she would experiment with different ways to display these messages. In my view, this is an example of where a talented Science Communicator like Tracey is needed. A graphics designer without a science background would not be able to independently generate and edit conceptual diagrams about Ecosystem Based Management.
This is the first time that we initiated, conducted, and completed a collaborative project entirely via the Internet, but most likely, not the last time this work style will be utilized. It proved to be a productive manner of working and given the distances and timing, the only way that we could have accomplished the task.
About the author
Bill Dennison

Dr. Bill Dennison is a Professor of Marine Science and Vice President for Science Application at the University of Maryland Center for Environmental Science.

