Calculating a Lake Health Index for the Great Lakes
Bill Dennison · | Environmental Report Cards | Science Communication |A State of the Great Lakes is produced periodically by Environment Canada and the U.S. Environmental Protection Agency. In the most recent assessment (2011), there are various classes of indicators that are used: water quality, aquatic-dependent life, landscapes & natural processes and swimming, fishing & drinking features. The water quality indicators include a) water column nutrient concentration, in particular, Total Phosphorus, b) toxicants in offshore waters, c) contaminants in whole fish and d) contaminants in water birds. The fish and bird contaminants are used as integrated bio-indicators of water column concentrations. The aquatic-dependent life indicators include a) Diporeia crustaceans that serve as fish food, b) walleye fish, c) lake sturgeon, d) lake trout, e) benthic density and abundance, f) prey fish populations, g) coastal wetland amphibians, h) coastal wetland bird communities, and i) coastal wetland plant communities. Each of these indicators was scored on a stoplight tricolor scheme (green = good; yellow = fair; red = poor).

I did not use the landscapes & natural processes indicators in developing the Lake Health Index. The reason that I did not use the landscapes and natural features indicators is that they were all watershed indicators: two measures of forest cover, a measure of aquatic connectivity (e.g., dams) and tributary flashiness. The reason that I did not use the public health indicators (swimming, fishing & drinking) is that these measures are fundamentally different than the ecological measures. Both sets of indicators are relevant and useful, just not for the purposes of developing a Lake Health Index.
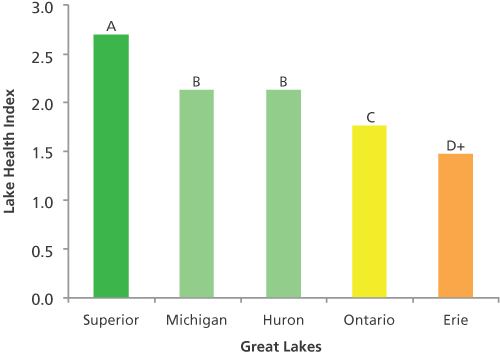
I conducted a comparison of the five lakes using the State of the Great Lakes: 2011 Highlights report. First, I converted the good, fair, bad rankings for the 4 water quality and 9 aquatic-dependent life indicators into a 3 (good), 2 (fair), 1 (poor) ranking. I then averaged the four water quality indicators into a water quality ranking, and the nine aquatic-dependent life indicators into an aquatic-dependent life indicator. Then a Lake Health Index was generated from the average of water quality and aquatic-dependent life indices. The resulting ranking was the following: Lake Superior (2.7), Lake Michigan (2.1), Lake Huron (2.1), Lake Ontario (1.8), Lake Erie (1.5). Converting these to letter scores, with a grading scheme of A = 2.5-3.0; B = 2.0-2.5; C = 1.5-2.0; D = 1.0-1.5; F = < 1.0; and +/- scores used for the upper and lower 0.1 of the grade ranges. Converting to letter grades using this scheme ranks the Great Lakes as follows: Lake Superior (A), Lake Michigan (B), Lake Huron (B), Lake Ontario (C) and Lake Erie (D+).

The relative rankings are fairly consistent with the individual lake summaries in the State of the Great Lakes: 2011 highlights report. The best conditions are consistently found in Lake Superior and the most degradation has occurred in Lake Erie. Furthermore, the similarities in Lake Michigan and Lake Huron scores are consistent with the degree of inter connectedness of these two lakes via the Straits of Mackinaw. The other lakes are separated by narrow river connections and operate more independently of one another.
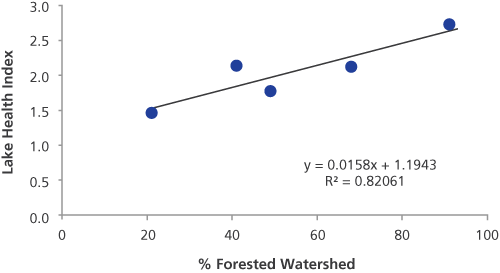
To test this ranking scheme with an independent measure, I correlated the percent forested area in each of the watersheds of the Great Lakes as reported in the Wikipedia page on the Great Lakes: Lake Superior watershed (91%), Lake Michigan watershed (41%), Lake Huron watershed (68%), Lake Ontario watershed (49%), and Lake Erie watershed (21%). The correlation that resulted was fairly strong, with an R squared value of 0.82. Also, the projections using the linear regression equation were fairly reasonable, in that the zero intercept for a watershed with 0% forest cover (1.19) comes out very close to 1.0 (F) and the projected forest cover for a perfect Lake Health Index (3.0) comes to be close to 100% forest cover (119%).

There are many ways that this analysis could be improved with access to the underlying data, a sub-basin level of analysis for more localized relative rankings, additional land use categories, etc. but the utility of this exercise is to demonstrate how individual indicators can be used to generate Lake Health Index. This Lake Health Index could be tracked over time to generate trends. The individual indicator values and trends can continue to be reported, it is just that this approach of combining indices can open up possibilities to better understand the Great Lakes and perhaps more effectively communicate their status to key decision-makers.
About the author
Bill Dennison

Dr. Bill Dennison is a Professor of Marine Science and Vice President for Science Application at the University of Maryland Center for Environmental Science.