Communicating science effectively—working through environmental report cards
Brianne Walsh · | Environmental Report Cards | Science Communication | Applying Science |In September, Simon Costanzo, Caroline Donovan, and I traveled to Edmonton, Alberta for a science communication course sponsored by the Alberta Biodiversity Monitoring Institute (ABMI). Participants had a diverse range of backgrounds and expertise, including researchers, planners, GIS analysts, communicators, and managers. All are involved with ABMI and their mission of monitoring the state of Alberta’s biodiversity to provide ongoing, relevant, and scientifically credible information on Alberta’s living resources for both decision makers and the public.


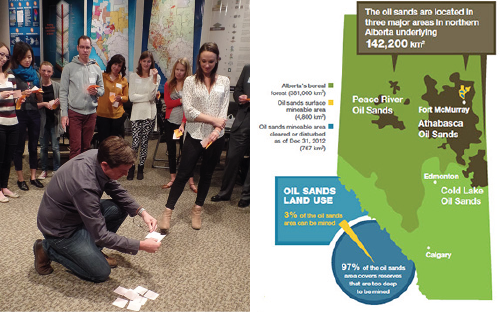
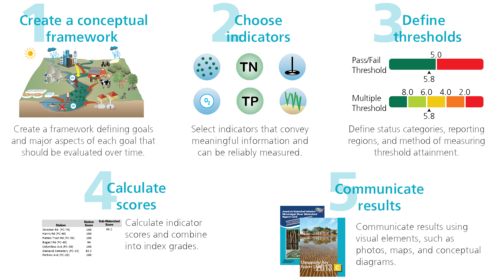
The course focused on the production of Ecosystem Health Report Cards, and throughout the two days, we infused the broader IAN science communication course materials into report card products, using the 5-step report card process as an outline. During the first step, “Conceptualizing the situation”, participants played SNAP, a game designed to identify the Values and Threats within the whole of Alberta.

From this activity, we were able to identify the top three values and threats, and these became our indicators for the remainder of the workshop. In addition, we chose a specific region of Alberta to be our example reporting region for our mock report card, and participants chose the Oil Sands Region, which lays Northeast of Edmonton.
For the remainder of the workshop, participants worked in groups to develop a mock report card for the Alberta Oil Sands region, working through the 5 step report card process, and picking up science communication tips and tricks along the way.

At the end of the workshop, groups had to pull together their activities and communications materials and present their findings and indicator scores in a 5 minute summary presentation. Each of the groups gave extremely effective presentations, and their ability to work through the report card process, in some cases even sourcing example data, was exciting to see. Within just two days of the course, participants understood the report card process and had applied it to a real life area (e.g. the Alberta Oil Sands), and were able to improve their science communication skills along the way.