Developing a report card for the coral reefs of American Samoa
Jane Thomas · | Environmental Report Cards | Science Communication | Applying Science |Heath Kelsey, Caroline Donovan, and I traveled to Honolulu, Hawaii to conduct a workshop to kick off the development of a report card for the coral reefs of American Samoa. The workshop (19-21 August) brought together folks working with NOAA’s Coral Reef Conservation Program, both in American Samoa and NOAA headquarters, to discuss the health of the reefs from the persective of the benthic, fish, climate, and socioeconomic monitoring that is undertaken by the Coral Reef Monitoring Program. More about this project can be found here.
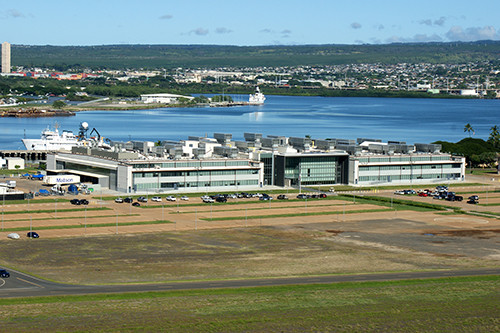
The workshop was held at the NOAA Inouye Regional Center (IRC) on historic Ford Island, which is part of Joint Base Pearl Harbor Hickam. The IRC is a world-class facility that repurposes two World War II-era aircraft hangars and is Leadership in Environmental and Energy Design (LEED) Gold Certified.
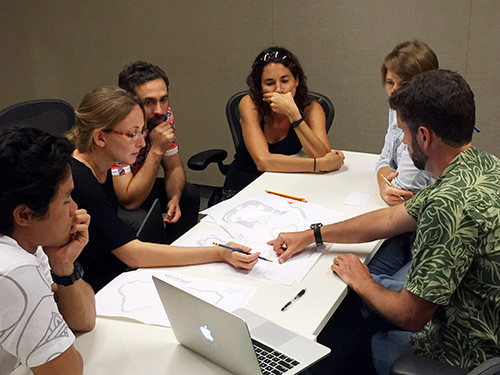
The first day of the workshop focused on introducing the goals of the report card topic, then we had the experts dive right into a conceptualization exercise where they identified key features and threats for the islands in the American Samoa archipelago.
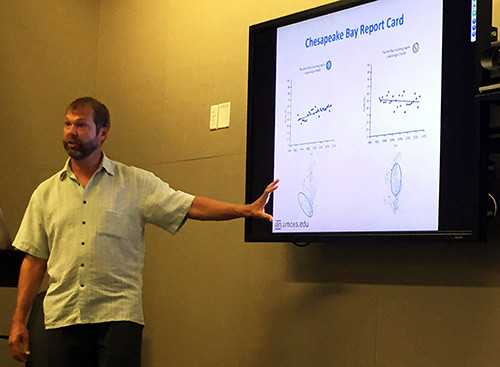
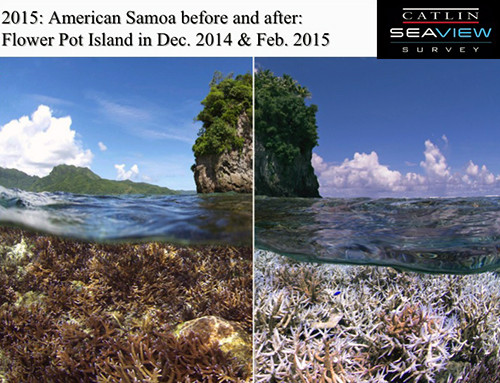
The second day of the workshop saw the monitoring folks presenting the data that they have been collecting. While the report card focuses on three aspects of NOAA monitoring data, we also heard about Coral Reef Watch climate data, American Samoa’s Department of Marine and Wildlife Resources data, and the National Park Service’s monitoring data. There is a wealth of information being collected on the health of coral reefs in American Samoa and future work will be to integrate these different monitoring data into one report card.
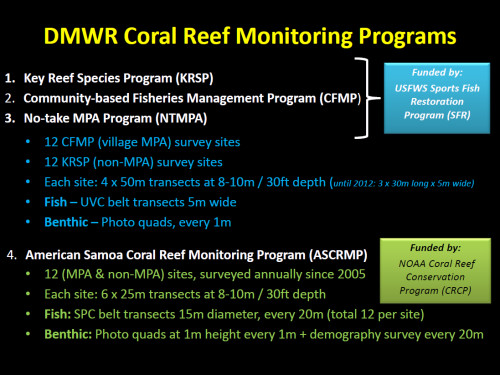
The afternoon of the second day focused on indicator details and storyboarding the overall report card. The participants sketched out the basic draft of the report card so that IAN staff could mock it up for the third day.
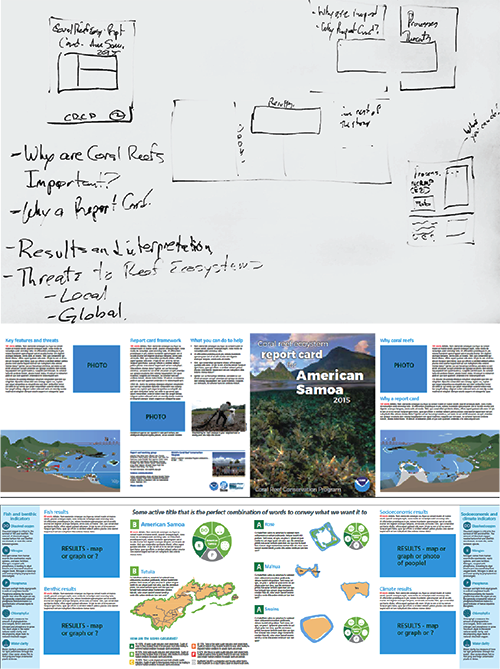
On the third day of the workshop, we reviewed all the aspects of the report card – the overall objectives and goals, the potential indicators, thresholds, and point of contacts for each section, and the draft of the report card. Participants were able to respond and discuss the different aspects of the report card among themselves and to visualize how the 8-page document would look to the public before heading out to their respective home locations.