

Diving Deep into the 2022 Chesapeake Bay and Watershed Report Card: Progress, Challenges, and a Call for Action
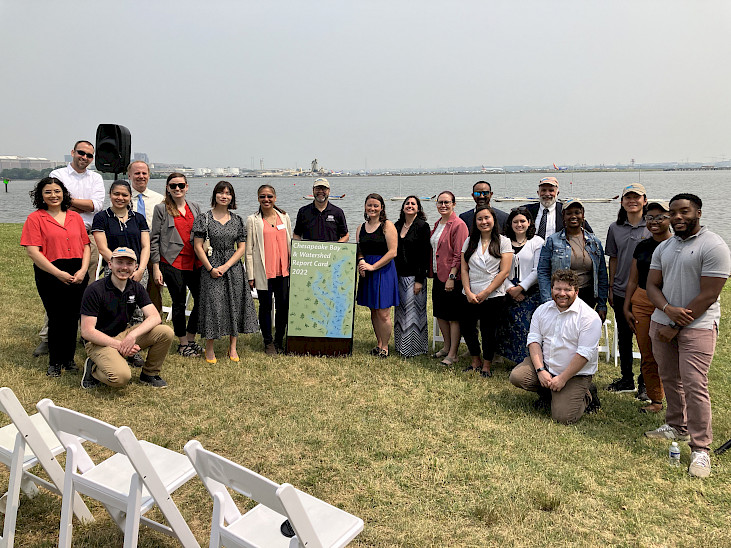
Anna Calderón · | Environmental Report Cards |With a newly included ecological indicator and Environmental Justice Index, this year’s 2022 Chesapeake Bay and Watershed Report Card is anything but ordinary. Providing a transparent, timely, and geographically detailed assessment of the Chesapeake Bay and Watershed, the 2022 report card was released by UMCES Integration and Application Network on June 6th, 2023 at Daingerfield Island’s Washington Sailing Marina in Alexandria, VA. COAST Card, a Belmont Forum project aiming to address socio-environmental challenges by combining socio-environmental report cards, system dynamics modeling, and social network analysis, also released its first Potomac-specific report card – the 2022 Potomac River and Watershed Report Card – that same day.
Joined by Virginia Secretary of Natural and Historic Resources Travis Voyles, U.S. Sen. Chris Van Hollen, Secretary of Maryland’s Department of Natural Resources Josh Kurtz, Maryland’s Secretary of the Environment Serena Mcllwain, and Deputy Director of the U.S. Environmental Protection Agency’s Chesapeake Bay Office Martha Shimkin, the report card was displayed for community and organization members, as well as the press, over the distant roar of occasional planes from Reagan National Airport.
Compared to the previous few report cards, the Chesapeake Bay’s score has significantly improved, receiving a C – a score of 51% – in this year’s report card. Senator Van Holland, referring to the progress made on bay restoration and protection shown in the improving report card grade, commented that “a clean bay supports a healthy economy and a healthy environment..that’s why we’ve fought so hard to protect and restore this national treasure, and this progress shows that the historic federal investments are making a real difference.” Similarly to the bay, this year the Chesapeake Watershed scored a 52%, a C, with a suite of ecological, economic, and societal indicators taken into account. Although this year’s watershed report card score did not include the new Environmental Justice Index, each census tract in the watershed is displayed with its corresponding EJI score within the report card.
What grade did the Chesapeake Bay receive?
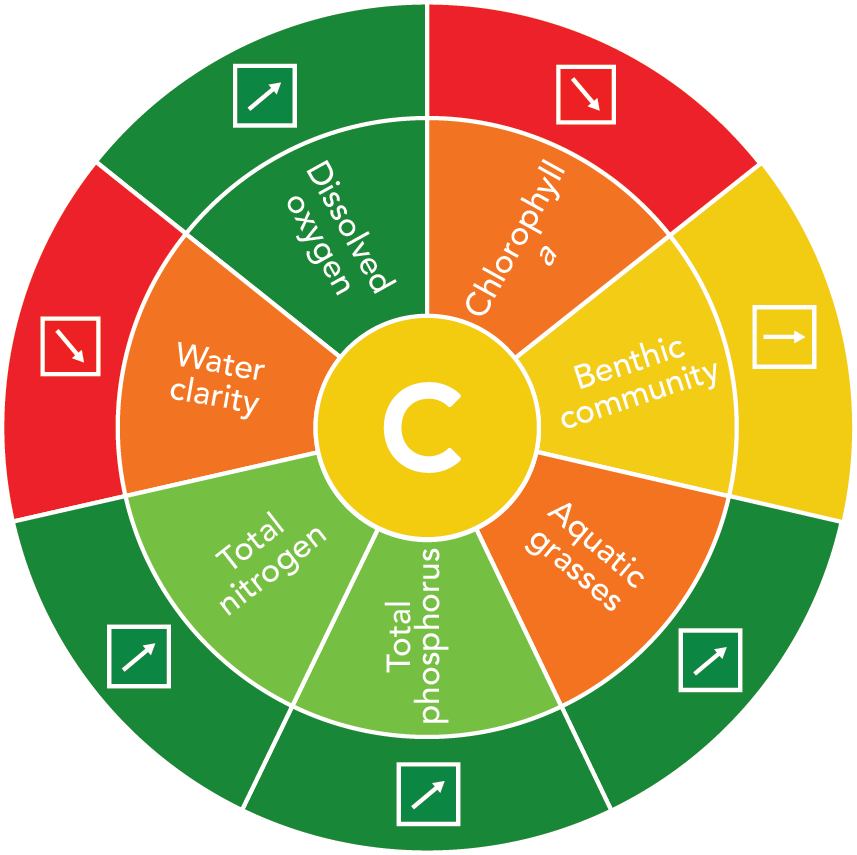
The 2022 overall bay score is 51%, a C, which is fortuitously up 6% within the past two years. The report card’s bay indicators that yield the overall bay score – total phosphorus, total nitrogen, water clarity, aquatic grasses, chlorophyll, fisheries index, dissolved oxygen, and benthic community – are the same suite of bay indicators used as the inaugural UMCES IAN report card in 2007 (apart from the “phytoplankton community indicator”, which became the “fisheries index” indicator). Among these bay health indicators, dissolved oxygen, total nitrogen, total phosphorus, and aquatic grasses displayed a significantly improving trend. It is important to note that, although water clarity does show a declining trend, its overall score has improved to 20% from 12% in 2021.
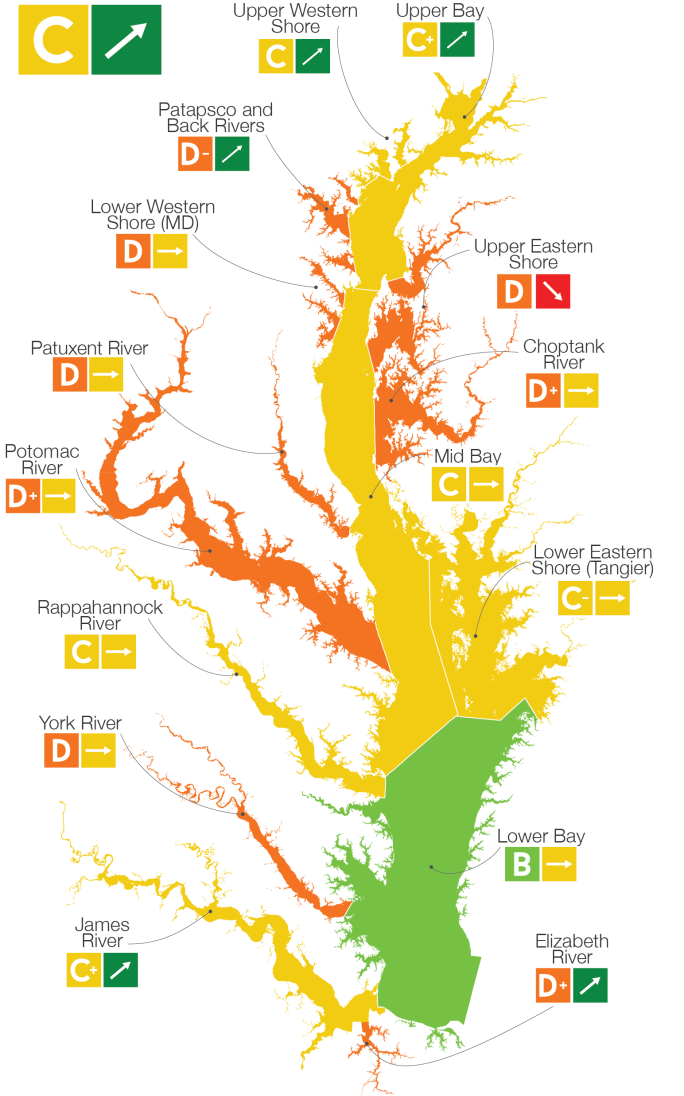
Although there are upward, improving trends in northern tributaries, many tributaries in the Chesapeake have received low scores this year. In terms of the 15 regions that divide up the bay in the report card, nine increased in their score, while six decreased. The highest scoring region within the bay, similarly to recent report cards, was the Lower Bay with a score of 69%. The lowest scoring regions were the Patapsco and Back Rivers, both with a score of 24%.
Another important low score to note is the blue crab score within the fisheries index, with blue crabs yielding their lowest score in several years. Blue crabs are crucial to the Chesapeake Bay, supporting commercial and recreational fisheries in the bay alike. Blue crabs also hold immense cultural significance to the watershed and are a keystone species in the water body’s food web. Unfortunately, blue crabs face fishing pressure during harvest, as well as fluctuating environmental conditions in water quality, oxygen “dead zones”, and especially loss of habitat in underwater grasses and marshes. Low scores like these within the report cards reveal that there is much more work to be done to combat climate change. As Martha Shimkin commented – “We’re running faster to stay in place with climate change” – carrying on a metaphor for bay protection and restoration that others used for running up an escalator.
What grade did the Chesapeake Watershed receive?
The Chesapeake Watershed’s score of a C, or 52%, in the 2022 report card can be broken down into a B- score for the suite of ecological indicators, a C for the societal indicators, and a C for the economic indicators.
The ecological indicator grade includes a new indicator – the “fish community index” – developed by the EPA examining the river health in categories including native species and pollution tolerance. The best scoring regions of the watershed for the ecological indicators were in the more forested regions, while the eastern shore of Maryland continues to score relatively poorly. The societal conditions in the watershed have worsened according to the seven point drop in the societal indicator category’s score of 47% in 2022. The scores in this category were overall moderate in most regions, but the two worst scoring regions were influenced by a decrease in the walkability and heat vulnerability indexes. Lastly, the overall economic score for the watershed was 51%, a C. The report card reveals that there tend to be better economic conditions on the western shore of the lower bay, and worse conditions on Maryland and Virginia’s eastern shore and in the upper reaches of the watershed in Pennsylvania and New York.
Environmental Justice in the Chesapeake Bay Watershed: Mapping Vulnerability and Promoting Equity
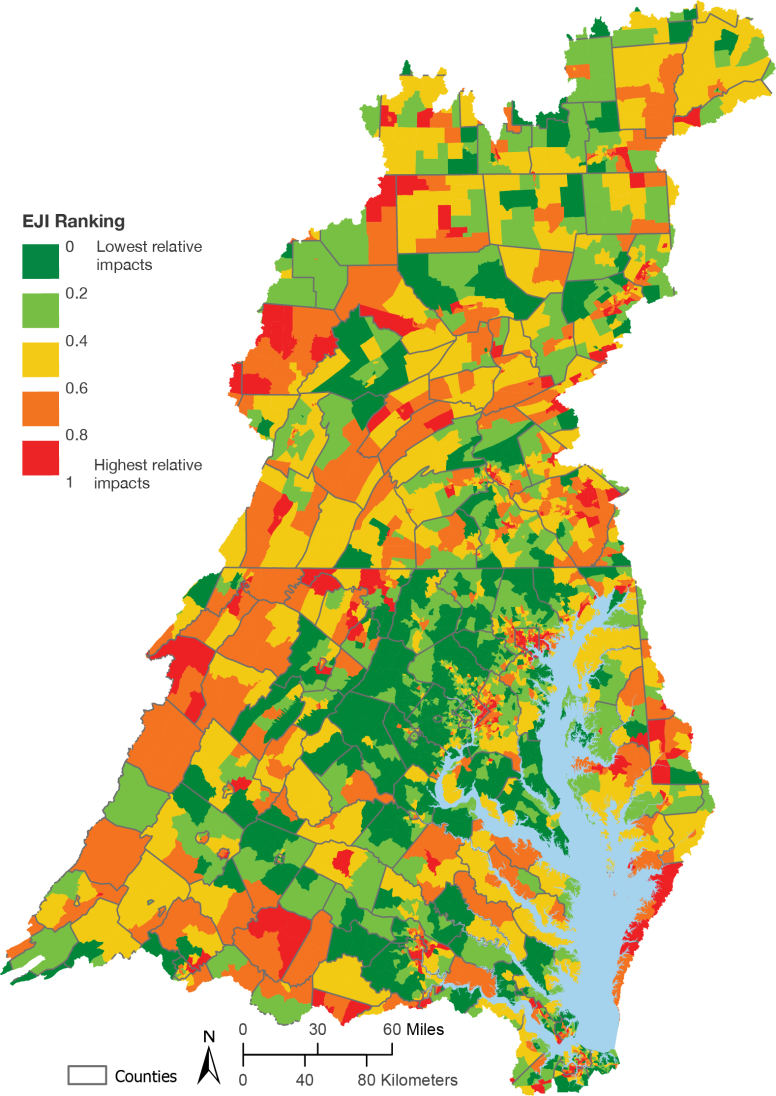
The Environmental Justice Index (EJI), included in the annual Chesapeake Bay and Watershed Report Card for the first time this year, is based on the Center for Disease Control’s Environmental Justice Index, which uses federal census data and is composed of three “modules”:
- Social Vulnerability – composed of Racial/Ethnic Minority Status, Socioeconomic Status, Household Characteristics, and Housing Type data
- Environmental Burden – composed of Air Pollution, Potentially Hazardous & Toxic Sites, Built Environment, Transportation Infrastructure, and Water Pollution data
- Health vulnerability – based on Pre-existing Chronic Disease Burden data
The report card includes a map of each census tract within the watershed, and its corresponding EJI Ranking, showing the extent of disparities in different areas of the watershed. The map and corresponding rankings reveal that suburban areas rank better in the EJI, while rural areas and cities experience higher impacts of these modules and therefore rank worse. Including EJI within report cards is crucial, as the index is representative of environmental conditions, health, social justice, and the economy in each of these areas. According to Dr. Bill Dennison, including the EJI in the report card “will make sure the report card is relevant to all communities in the Chesapeake watershed. We need to have healthy communities to ensure that we achieve a healthy Chesapeake Bay. Addressing environmental justice is critical to ensure that restoration enhances long-term sustainability of the Chesapeake Bay watershed in an equitable way.”
Listening to the Voice of the Watershed: Engaging Residents' Values and Concerns:
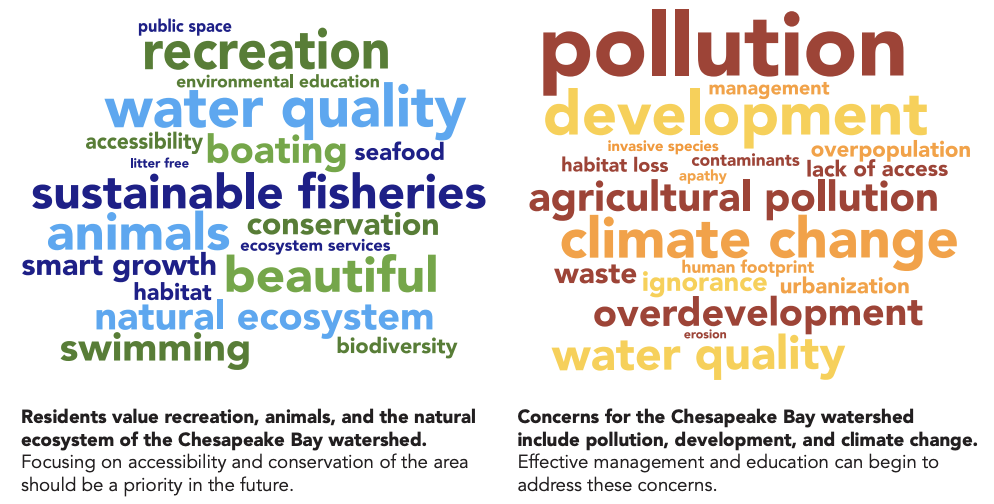
In order to continually address and take into account the questions and concerns of the community and their values, UMCES IAN will continue to host stakeholder listening sessions. Engaging stakeholders in the development of these report cards affirms that the needs and concerns of the community are regarded and addressed, particularly community members who have been historically left out of conversations relating to coastal management and environmental sustainability decisions. So far, this year’s listening sessions have been in Baltimore, MD; Alexandria, VA; Leonardtown, MD; and Woodbridge, VA, and Cumberland, MD.
We thank UMCES President, Dr. Peter Goodwin and the UMCES Vice President of Science Applications, Dr. Bill Dennison for their leadership and guidance. We would also like to thank the esteemed representatives and organization members who joined us at the report card release, including Travis Voyles, Chris Van Hollen, Josh Kurtz, Serena Mcllwain, and Martha Shimkin.
We recognize indigenous and native people who originally occupied and tended to the land and waters of what we know today as the Chesapeake Bay Watershed. The Chesapeake Bay Watershed includes historic lands settled by the Accomack, Arrohatec, Chesoenhaka (Nottoway), Chesapeake, Cuttatawomen, Doeg, Ho-de-no-sau-nee-ga (Haudenosaunee), Kecoughtan, Kiskiack, Lənape Haki-nk (Lenni-Lenape), Lumbee, Manahoac, Massawomeck, Monacan, Nacotchtank (Anacostan), Nandtaughtacund, Nansemond, Nentego (Nanticoke), Occohannock, Onawmanient, Onöndowa'ga:' (Seneca), Pamunkey, Patawomeck, Piscataway, Pissaseck, Pocomoke, Powhatan, Quiyoughcohannock, Rappahannock, Sekakawon, Susguehannock, Warraskoyack, and Youghtanund.
References
Chesapeake Bay Foundation. Blue Crabs. Chesapeake Bay Foundation. https://www.cbf.org/about-the-bay/chesapeake-wildlife/blue-crabs/index.html
Chesapeake Bay Program. Blue Crabs. Chesapeake Bay Program. https://www.chesapeakebay.net/issues/whats-at-risk/blue-crabs
Vargas-Nguyen, V., Fries, A., Dennison, B., Laumann, K. M., Edgerton, J., Anderson, S., Badri, L., & Kelsey, H. (2023, June 6). 2022 Chesapeake Bay and Watershed Report Card. University of Maryland Center for Environmental Science Integration and Application Network. https://ian.umces.edu/publications/2022-chesapeake-bay-and-watershed-report-card/
About the author
Anna Calderón

Anna Calderón is a returning Global Sustainability Scholar working on the transnationally-focused COAST (Coastal Assessment for Sustainability and Transformation) project based at UMCES. She recently graduated from Wellesley College with a degree in Geosciences, and is passionate about addressing water scarcity, understanding hydrological systems in light of climate change, and participating in serendipitous community-based science. Currently, she is continuing her work on researching flooding and sea level rise within the Chesapeake Bay. Anna’s contact information is asofiacalderon5@gmail.com.