

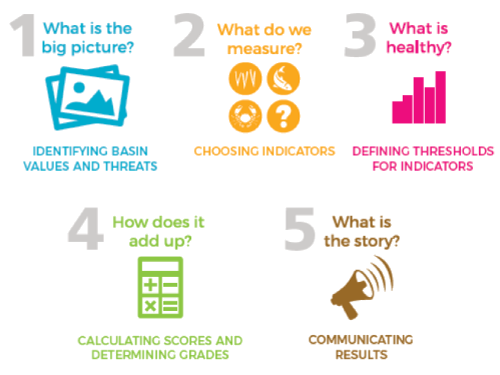
How much is too much? Defining thresholds for indicators
Agness Sililo Musutu, Andrea Rivera-Sosa · | Environmental Report Cards | Science Communication | 1 commentsAgness Sililo Musutu and Andrea Rivera-Sosa
(aka the "A" team)
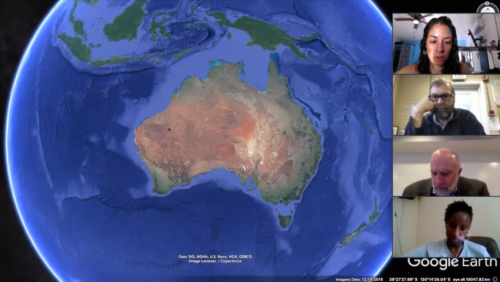
The fourth class of our Developing an Ecosystem Health Report Card course was facilitated by our guest lecturer, Dr. Simon Costanzo, who is based in Australia. Despite the huge time difference, he was kind enough to be up at midnight to teach Lecture #4, which is Step #3 of the 5-Step process of creating a report card referred to as "What is Healthy? Defining report card thresholds" (Costanzo et. al. 2017).
The class started with brief introductions including name, country, organization and why the interest in making report cards from all of the participants. Simon then followed up with a description of the arid Australia and the beautiful Moreton Bay. He contextualized the coastal challenges in Brisbane (algal blooms, sedimentation and water quality issues), since ∼95% of the population is located within 100km of the coastline. We can see more on the long-term status of Brisbane within the Healthy Land and Water Report Card series, which actually is on their 20-year anniversary! This was part of Simon's PhD work and our course professor, Dr. Bill Dennison, was his advisor.
Bill also shared with us, the opportunity to attend the Annual Riversymposium in Brisbane, Australia scheduled for October 2019. This Symposium is an academic/social science forum which brings together Australian and international stakeholders to share their innovative work primarily on river ecosystems. Interested individuals should submit their abstract by 15th March 2019 - and remember a number of awards and prizes are given for excellence in water management!!!
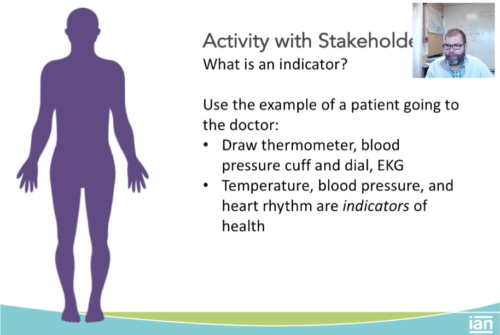
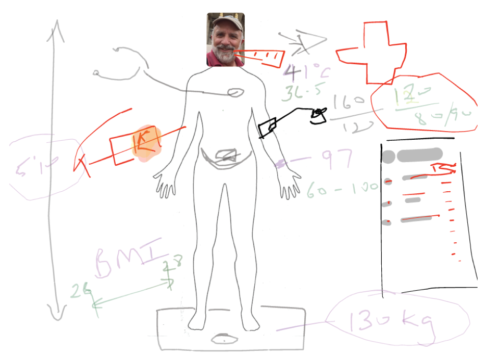
Simon then followed up with a fun activity (the “Bill Exercise”) which may assist stakeholders in the identification of indicators and thresholds. We did an example of a patient going to the doctor and asked – “What does the doctor measure when you are sick?”. The class joined in to mention a list of indicators such as: temperature, blood pressure, weight, height, etc. These were then discussed in the "lens of thresholds" or also known as vital signs, benchmarks, standards and desired conditions. We identified thresholds to all these indicators and also talked about the relation of two or more indicators (i.e. Body Mass Index calculated from weight, height). This activity shows that we use thresholds in our everyday life.
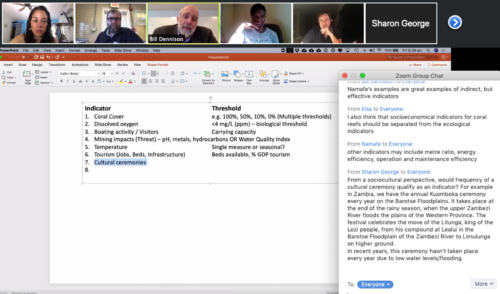
After the “Bill Exercise”, we then followed up with the Threshold Decision Tree activity. Vanessa Vargas-Nguyen, our awesome teacher assistant for the course, emailed us with two tasks in mind. 1) To identify an indicator and potential thresholds (to have something to compare our values to) and 2) Provide a potential report card indicator in our part of the world that do not necessarily have a threshold. Then, we had the opportunity to mention the proposed indicators in the zoom meeting and thresholds.
Some of the identified indicators included: 1) coral cover, 2) dissolved oxygen, 3) boating activities, 4) mining impacts, 5) temperature, 6) tourism and 7) cultural practices. We then identified multiple thresholds which varied from various percentages, biological thresholds, carrying capacity, economic (% GDP) and socio-cultural. This is the most controversial part of the report card process and it is very easy to go around and around in circles discussing the thresholds and indicators and get stuck like most scientists do. Therefore it's important to remember that “thresholds will vary depending on the point of view which could be (environmental, socio-cultural or economic)”. One must be aware and open to discuss the various points of view with the stakeholders to identify the “vital signs” and make a decision.

We were also cautioned that it's hard to find scientific literature on thresholds and indicators, thus it is important to document, provide rationale and be transparent in how the thresholds and indicators were selected. “Documenting the methodology used and why, will allow you to justify your selections”. Thresholds can also come in different forms, they can be regulatory requirements, biological requirements, etc. They can also come in different units, but it is important to ensure that we use the same (standardized) units by converting all our indicators to the 0 - 100 score (This will be coming up in our next lecture #5 and Step 4: How does it add up?).
One way to look for thresholds is to look at historical observations (elders) or data, expert opinions, geography, space, etc., to come up with aspirational thresholds. However, some indicators like temperature, which Simon tries to stay clear of, have moving thresholds therefore they can be difficult to measure. In cases where such indicators can't be avoided, it is important to make the direct linkages to values or biological thresholds e.g. salmon will not survive when the temperature is below a certain level.
We also discussed about methods on how to measure social capacity. This is an interesting research area, which has a science to the calculation of how many people can be present in an area, without undermining the ecosystem. The Lecturers will share literature on calculating social carrying capacity. Another aspect brought up by our colleague Sharon George, included the topic of cultural ceremonies. This is an indicator that continually keeps of appearing, she presented the interesting case using the group chat.
It is also extremely important to consider tradeoffs in the identification of thresholds. For example, a coral reef which has more visitors to the reef will probably have a higher economic value, however, an increased number of visitors may have negative impacts and be more harmful to the reef. Therefore, if we only consider the economic aspects of the threshold, it may be a "boom and gloom" for the ecosystem we want to preserve.
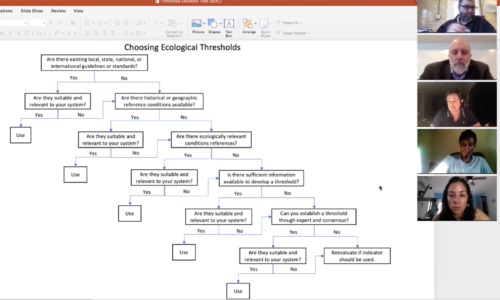
Once we have the identified indicators and tentative thresholds, we can use the Threshold Decision Tree. The decision tree helps choose the "best" or most "appropriate" ecological threshold by going up and down the list. This step rank order helps identify through a series of questions if the indicators are suitable and relevant to your system. Our goal is to end up with a handful of good indicators that can be consistently measured over time.
Moreover, this bottom up approach alongside the stakeholder’s involvement ensures credibility and allows a transparent process in the identification of indicators and potential thresholds. Overall, there are many examples on how the top down strategies have been considered as purely academic exercise have not worked. For this reason, the key to stakeholder engagement is participation and discussions throughout the whole process. This step can be the most challenging and is an evolving process but it's achievable!
Finally, we end this blog with two key advice from our course professors for the process of thresholds identification: 1 - don't forget to document the whole process in a white paper that accompanies the report card; and 2 - establish attainable thresholds and refrain from setting up thresholds that can be too strict with either too high or too low values.
See you next class, where we will cover Step #4 of the Report Card Process on how to best calculate the report card scores!
Reference:
Costanzo, S.D., Blancard, C., Davidson, S., Dennison, W.C., Escurra, J., Freeman, S., Fries, A., Kelsey, R.H., Krchnak, K., Sherman, J., Thieme, M. Vargas-Nguyen, V. 2017. Practitioner’s Guide to Developing River Basin Report Cards. IAN Press. Cambridge MD USA.
Next Post > CMC Data Interpretation Course in Richmond, VA and Carlisle, PA
Comments
-
Ricardo Merlos 7 years ago
I appreciate having Dr. Simon Costanzo on this occasion despite the schedule difficulties. About the threshold decision tree I'll like to highlight something mentioned upwards and by Dr. Heath Kelsey on class, and it is the question, Are they (thresholds) suitable and relevant to your system? It's better to be sincere solving this question first before stepping a quicksand.