How to create conceptual cross-section diagrams
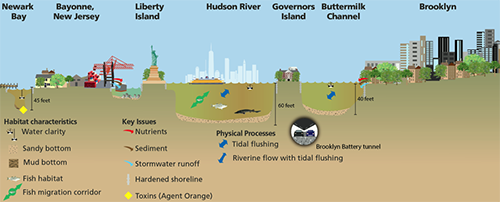
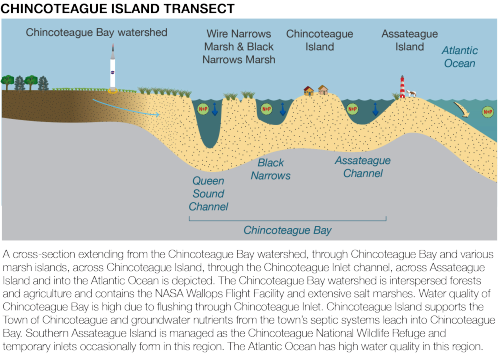
Bill Dennison · | Science Communication | Applying Science | Learning Science |Conceptual cross-section diagrams are a new technique developed by the IAN symbol library, allows for a geographically accurate depiction of coastal waterways. The first use of these cross-section approach was for New York Harbor, developed because of the complex waterways, islands, bridges and tunnels in New York Harbor. Brianne Walsh created a series of multiple cross sections using east-west transects extending from New Jersey to Long Island. The second use of this technique was for the Maryland Coastal Bays. Jane Thomas created east-west transects extending from the mainland, through the coastal embayments and into the Atlantic Ocean. This blog explains the method we used to create these diagrams.


1. The first step is to use a map of the region and decide on the location of transects. This choice is informed by a) orientation of the transect (e.g., east-west), b) the key processes of the region, and c) the presence of iconic features like bridges or buildings that help orient the viewer.
2. The next step is to draw the transect on a map. We use Google Maps to draw a transect and calculate distances between the various geographic features (e.g., shorelines, channels, islands). These distances are used to provide accurate horizontal transitions.
3. Vertical relief is next developed for the diagrams using topography maps for terrestrial environments and using bathymetry maps for marine or aquatic environments. The scale for vertical relief is exaggerated in order to distinguish water depths and land heights, a common technique employed in mapping.
4. The next step is to combine the horizontal transects with vertical relief to create a base profile. This base profile provides the format to populate various transect features.
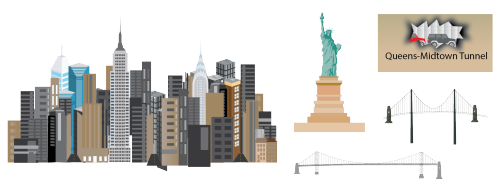
5. Once a base profile has been created, then a series of symbols can be chosen to depict the various iconic natural and human features of the region. New symbols often need to be created at this phase if the IAN symbol library doesn't contain the requisite symbol(s). For example, Brianne Walsh created symbols for New York Harbor cross sections like the Empire State Building, Verrazano Bridge, George Washington Bridge, Freedom Tower. Jane Thomas created symbols for Maryland Coastal Bays transects like the Assateague Island lighthouse, Ocean City Ferris wheel, and Wallops Island rocket.

6. Various data maps are sought out to help interpret cross-section features. For example, a sediment map is often useful to distinguish silt, mud, sand and gravel. Various key habitats are also important and various habitat maps are consulted (e.g., marshes, seagrasses, oyster reefs). Water quality maps are an important source of information as well, so that water-color can be inferred (levels of water clarity, chlorophyll, suspended solids), zones of low dissolved oxygen identified, and nutrient levels depicted.
7. Google Earth is used to zoom into chosen regions so that shoreline types can be identified (e.g, hardened, marsh, beach), building density and type determined, and forested areas or riparian vegetation observed. Key manmade features include sewage treatment plants, roads and bridges can be identified from Google Earth.
8. Site descriptions are consulted to identify iconic species like fish, birds and other wildlife which can be used in the cross-section diagrams. In addition, runoff from impervious surfaces, submarine discharges of groundwater or sewage effluent, and tunnels which are not easily visible on Google Earth can be inferred.
9. A figure legend is written for each cross-section which serves as a way to help prioritize the key issues and features to be included on the conceptual diagram. In addition, the dates that various structures are completed can be included. The depths of tunnels and submarine discharges can be accessed with some investigation as well.
10. The draft conceptual cross sections are reviewed by various experts to check for accuracy as well as communication effectiveness. Most people are surprised to learn about the relative depths and heights of various features. They also comment on the ability of the diagrams to accurately reflect the look and feel of a region. For example, the initial New York City buildings were too clean and colorful, so we muted the brightness and colors to more accurately depict the city.

There are many other styles of conceptual diagrams, including three dimensional, mirrored diagrams, triptychs, etc., but the development of these conceptual cross sections offers a way to create informative and geographically accurate diagrams. This style of conceptual diagram requires an integrative effort, accessing a wide variety of geographical and ecological data. I am glad that we can add this conceptual diagram style to the IAN repertoire.
About the author
Bill Dennison

Dr. Bill Dennison is a Professor of Marine Science and Vice President for Science Application at the University of Maryland Center for Environmental Science.