Innovations in Environmental Synthesis, Reporting and Governance: Part 7 - Innovations in Environmental Reporting
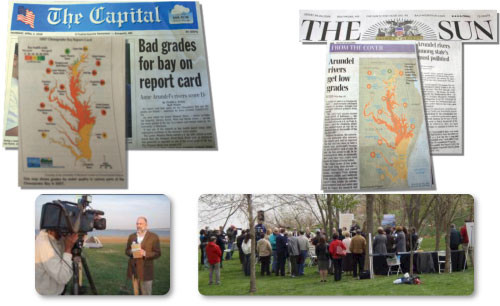
Bill Dennison ·I want to talk about innovations in environmental reporting. One of the things we stumbled upon in Southeast Queensland is environmental report cards, and I got to thinking why they are so powerful. I have two teenage children, who you can definitely see are driven by peer pressure in their everyday life. Peer pressure is a really powerful motivator. We got calls from mayors in Southeast Queensland asking “How’d I do?” “You got a C-“ “Can we do anything for extra credit?” We would learn to tell them in advance to give them time to put their spin on it and understand it. We train students for twelve years in education to work through report cards. They synthesize a lot of data, and the political leadership really understands these reports and often what they want to do is a little better than the next guy. These report cards catalyze action. There are a couple of hundred thousand data points that are incorporated into each report, and for every report card we have an associated web page that goes up as well. We have around 240 web pages of new maps and supporting material that go live each year. Report cards are a really good way to focus on diffuse pollution that isn’t point source driven, and easily monitored. It’s a way to aggregate indicators that we need and diffuse pollution issues, and the data gathering capacity that we’re creating with our sensors and TERN networks, which is dramatically increasing. They also generate media attention - they tend to get on the front page.

I will argue that the Chesapeake Bay is probably the best studied estuary in the world. It has had more history of science and practically invented estuarine science. Chesapeake Bay has more labs and student theses and insights generated than anywhere in the world. But, putting together three water quality indicators (chlorophyll, dissolved oxygen, and water quality) into a water quality index, add three more indicators of biotic factors (benthic, phytoplankton, and underwater grasses) to create a biotic index, and then aggregate them together to create a report card, which is from a quantifiable database, you can have real insights that you wouldn’t have looking at any one of those indicators, and doing a bunch of other science. Looking at a couple of sites, we had three out of the fifteen that were good and getting better. We had three that were bad and getting worse. We had nine that did not have any real trend. So, we had to ask ourselves “What are the positive and negative ecological feedbacks that are creating positive and negative trajectories?” We found that the presence of aquatic grasses creates a positive feedback, and the lack of oxygen creates a negative feedback. The Maryland Governor took a real interest in these trajectories and picked out a specific site to go to.
This blog post was created from a presentation by Bill Dennison to the Terrestrial Ecosystem Research Network in Melbourne, Australia on 29 Mar, 2011 (full powerpoint presentation can be accessed on IAN Press.
About the author
Bill Dennison

Dr. Bill Dennison is a Professor of Marine Science and Vice President for Science Application at the University of Maryland Center for Environmental Science.

