Innovations in Environmental Synthesis, Reporting and Governance: Part 8 - Environmental Report Cards
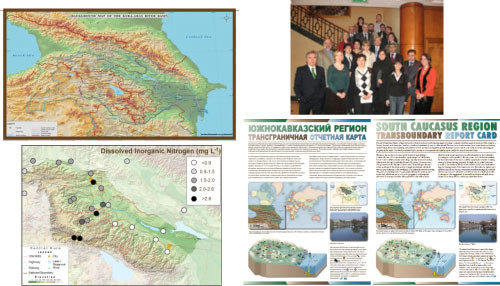
Bill Dennison · | Science Communication |Report cards are also a great way to bring together disparate groups. An extreme example is that the US State Department was trying to mediate some dialog between Armenia, Georgia and Azerbaijan when Armenia and Azerbaijan were technically still at war. So we got together with them, and we put up this first map of six indicators. They had never seen this map or this data before. If you can mediate a discussion using these maps in this hostile area, then differences between Maryland and Virginia in the Chesapeake Bay are nothing. This is really a transboundary divide that can be conquered, at least in part by the commonality of reporting frameworks and environmental report cards.

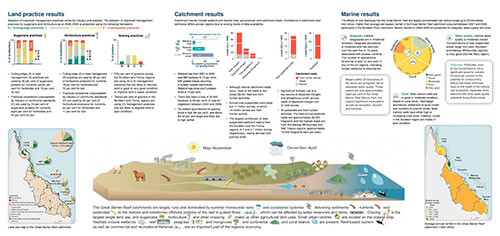
We have developed a Great Barrier Reef report card, and what this report card uniquely did was use pressure, state and response. Usually our environmental report cards have been 'state-of-environment centric'. In the Great Barrier Reef report card, we included land practices. The sugarcane growers are providing data as well as the graziers, the horticulturists and the grain farmers. We're providing management response indicators, and we’ve got pressure indicators with CSIRO and the Department of Environment and Resource Management in Queensland are collecting data using remote sensing and catchment models to look at loads.

We have the Great Barrier Reef Marine Park Authority and SeagrassWatch volunteers collecting seagrass, coral, and water quality data to look at the state of the reef. We can actually put together pressure, state and response indicators in this report card. Back to the common theme of today, what we’ve really found is that there is a rich reservoir of really interested people that have tried some kinds of volunteer science, but if it doesn’t go anywhere they lose the attraction, and the initial burst of enthusiasm fades away quickly. But if we provide them the tools to generate a report card, a regionally specific report card, and can constrain them somewhat and say “here are the core indicators, and these are electives. So, you’ve got to at least do these six, and then you can do whatever else you want.” We can get some agreement on that and produce some legitimate regional report cards, which the government will never have the funding to do. We’ve got 166 sites for water quality in the Chesapeake Bay, and that’s as much as well ever being able to manage. So we’ve created a protocol manual, and got some real momentum going on that. So I’m really excited about using citizen science water quality data to help generate these report cards.
This blog post was created from a presentation by Bill Dennison to the Terrestrial Ecosystem Research Network in Melbourne, Australia on 29 Mar, 2011 (full powerpoint presentation can be accessed on IAN Press.
About the author
Bill Dennison

Dr. Bill Dennison is a Professor of Marine Science and Vice President for Science Application at the University of Maryland Center for Environmental Science.