Launching the Chesapeake Bay Story website: Telling fact-based stories about Chesapeake Bay health
Bill Dennison ·In a partnership with the Maryland state government, the Chesapeake Bay. This website (chesapeakebaystory.umces.edu) uses water quality, fisheries and habitat data, various maps and graphs, and scientific publications to inform a narrative version of the historical trends of Chesapeake Bay health. The website describes various ecosystem health indicators, and displays annual maps and graphs using a slider bar on a timeline, as well as a map grid which displays summary maps for every year. The website also describes the major causes of degrading ecosystem health, and displays relevant data and trends.
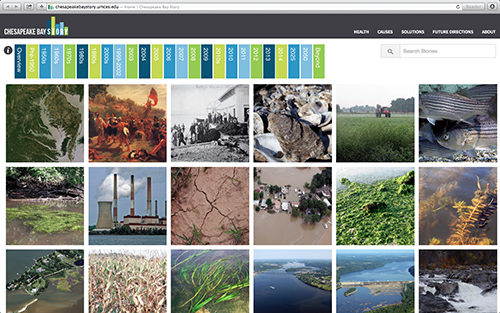
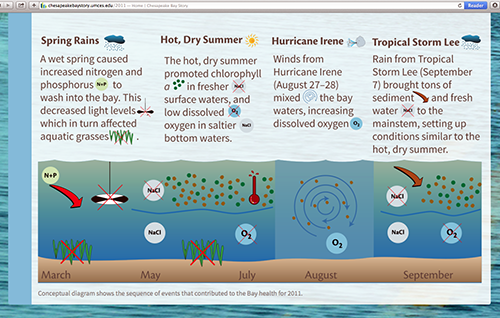
This website is a series of 'books', with each 'book' devoted to tell the story of a year or a decade, going back in time as well as projecting into the future. An iconic image and summary sentence is accompanied by a short description of the key contributions to Chesapeake Bay health. For each 'book', more information is provided using graphs, maps, photographs and explanatory text.
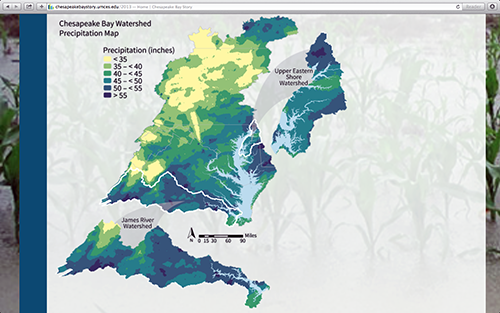
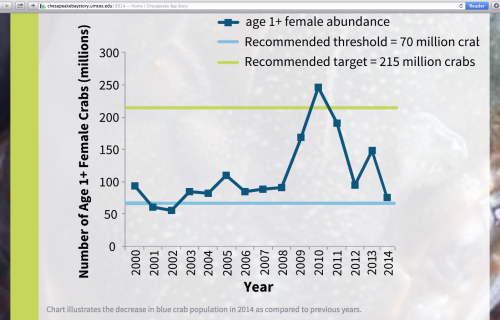
A variety of health factors were used: bay health index, nitrogen, phosphorus, dissolved oxygen, chlorophyll a, water clarity, aquatic grasses, blue crabs, striped bass, bay anchovies. Each of these health factors is tracked annually back to 1986. Causes of Bay health degradation were categorized as runoff, population and impervious surfaces. Annual Chesapeake watershed precipitation maps back to 1984 are presented is this section to better understand where runoff is generated. Solutions included sections on clean water, clean air, nutrient goals, and fisheries. The solutions section draws from the recent "New Insights: Science-based evidence of water quality improvements, challenges, and opportunities in the Chesapeake" report. Future directions included sections on climate, growth, clean water goals and land uses.
The impetus for this website was prompted by Maryland Governor Martin O'Malley (2009-2015) who asked for a more narrative form of understanding Chesapeake Bay health to complement the data-based Chesapeake Bay report card. Mike Powell spearheaded the effort from the Maryland state agencies, with constructive input from the Departments of Information Technology, and Natural Resources and Environment. In addition, Drs. Walter Boynton and Michael Kemp reviewed the web content and offered many useful comments. We will also be soliciting additional input and update this site with new or additional content as it becomes available.
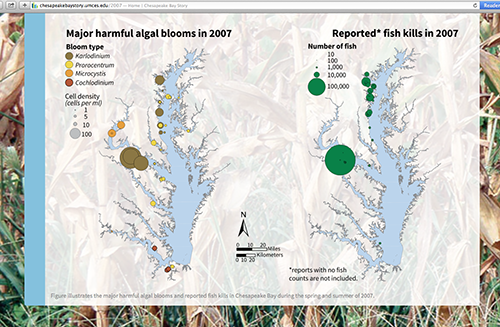
I found this effort to be quite interesting, as it catalyzed a synthetic process of interpreting different kinds of data. It became quite evident from the health trends why the various management initiatives were initiated, e.g., fisheries management and Chesapeake Bay agreements. The biggest challenge was developing future projections given the various uncertainties about management implementation, climate change and future land use and population trends.
We are very interested in obtaining feedback on this website and encourage comments, suggestions or additional information sources. We ask that viewers can share this website with others as well as review it themselves. We hope that this website will help scientists and resource managers develop a better historical context for Bay restoration, help teachers develop accurate and timely Bay related materials, and help policy-makers develop informed approaches to Bay issues. We also hope that everyone who views this site enjoys learning more about this amazing Chesapeake Bay story.
About the author
Bill Dennison

Dr. Bill Dennison is a Professor of Marine Science and Vice President for Science Application at the University of Maryland Center for Environmental Science.

