

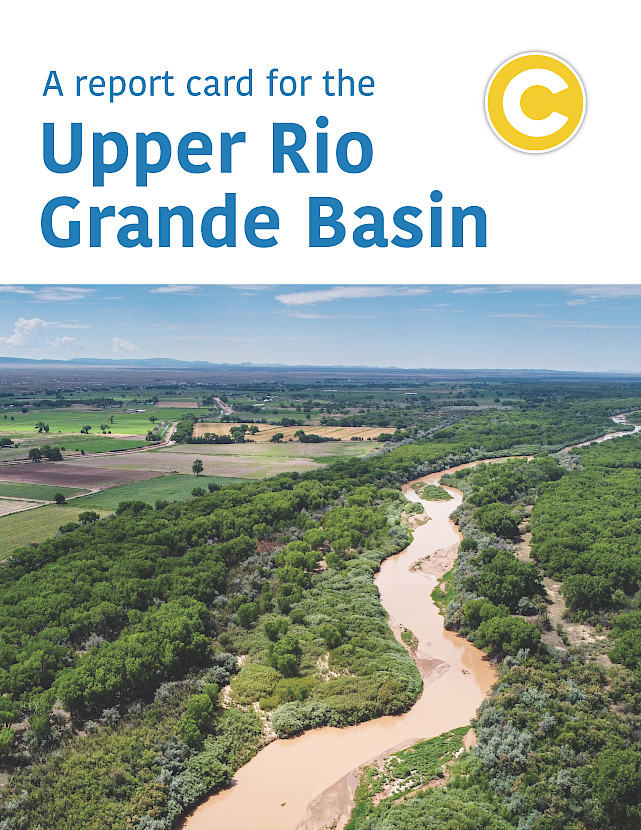
Lessons learned from a two and a half year project on the Upper Rio Grande
Nathan Miller · | Science Communication | Environmental Report Cards |This past November, IAN, in collaboration with its partners from WWF, Audubon Southwest, and The University of Massachusetts Amherst published a socio-environmental health report card for the Upper Rio Grande. The report card covers a section of the Rio Grande that stretches from the river’s headwaters in the Colorado Rockies to Fort Quitman, TX. Project members cast a wide net to retrieve relevant data that would allow us to analyze the region's environmental, social, and economic conditions. By conducting surveys with local community members, as well as scoring indicators such as fire management and the amount of water available to farmers, we worked to ensure that our assessments were both empirically sound and reflective of how communities living along the Rio Grande perceive their social and environmental health. Overall, the Upper Rio Grande received a C score, meaning that region is in moderate condition. That score is primarily based on the reality that this stretch of the Rio Grande is stressed from heavy municipal and agricultural use, a prolonged drought, and aridification, the latter two of which undergird the existential threat that climate change currently poses to the region.
Producing this report card over the last two and a half years presented a number of new challenges and opportunities for both the IAN team as a whole as well as individual team members. For me, some of the challenges were rites of passage for any IAN science communicator (i.e.: building an indicator from the ground up), and the integration of modeling scenarios created the first opportunity for us to discuss future management outcomes in a publication. And considering that this project began in July 2020, four months into a global pandemic, we had to adapt to a new method of stakeholder engagement, one that would allow us to still meaningfully engage with stakeholders who care about the Rio Grande while also acknowledging that our collective health demanded remote work.
The Upper Rio Grande was the first project at IAN where I got to work on from start to finish. Though I had already been at IAN for 18 months when the project started in July 2020, most of my work up to that point had been on projects that were in various stages of development. All the report cards I had worked on until July 2020 already had a set list of indicators as well as a methodology for how to measure those specific indicators. Project managers on those report cards had already developed relationships with key stakeholders and coordinators; so it often felt like having to play catch up as I was brought onboard projects midway through.
It was really an eye-opening experience sitting down with stakeholders (sitting down over Zoom, but sitting down nonetheless) during our first round of workshops in the Fall of 2020. Stakeholders collectively valued the social, cultural, economic, and environmental features of the Rio Grande that had made this region of the country livable for centuries, and there was a general consensus on what is threatening the sustainability of the river as well: increasing water demands from growing metropolitan communities compounded by the continued agricultural needs for water, increasingly unpredictable seasonal snowmelts, fires, drought, development, and climate change. It was so exciting to listen to their input and explore ways that we could quantifiably measure both those values and threats, synthesizing data and feedback so that we could assess environmental health on the stakeholders’ terms. This is science communication at its core—making scientific information accessible and relevant to the people who need it. It’s why I wanted to work at IAN in the first place.
Once we had selected the indicators we would use to determine socio-environmental health, it was time to conduct research, collect data, and analyze said data. While I really appreciated this chance to perform data analysis, as someone whose strengths lean more heavily on the “communication” elements of science communication, there were several analytical cobwebs I had to dust off as well as new skills I had to learn.
For me, the most rewarding experience during this period of report card development was learning how to use GIS software so that I could do a spatial analysis of preventative fire treatments and impaired streams. I just scraped by in my GIS class during grad school, and programs such as ArcMap had terrified me ever since. So, I was a bit nervous when I was tasked with extracting data from shapefiles and raster data sets. Fortunately, my IAN team was really supportive, showing me how to perform simple intersection functions as well as how to filter out data in ArcMap spreadsheets. This helped both quell my nerves about returning to a subsection of data science where my skills are, how to I put this kindly, up and coming as well as allow me to generate reliable scores for both the fire management and impaired streams indicators seen in the final report card.

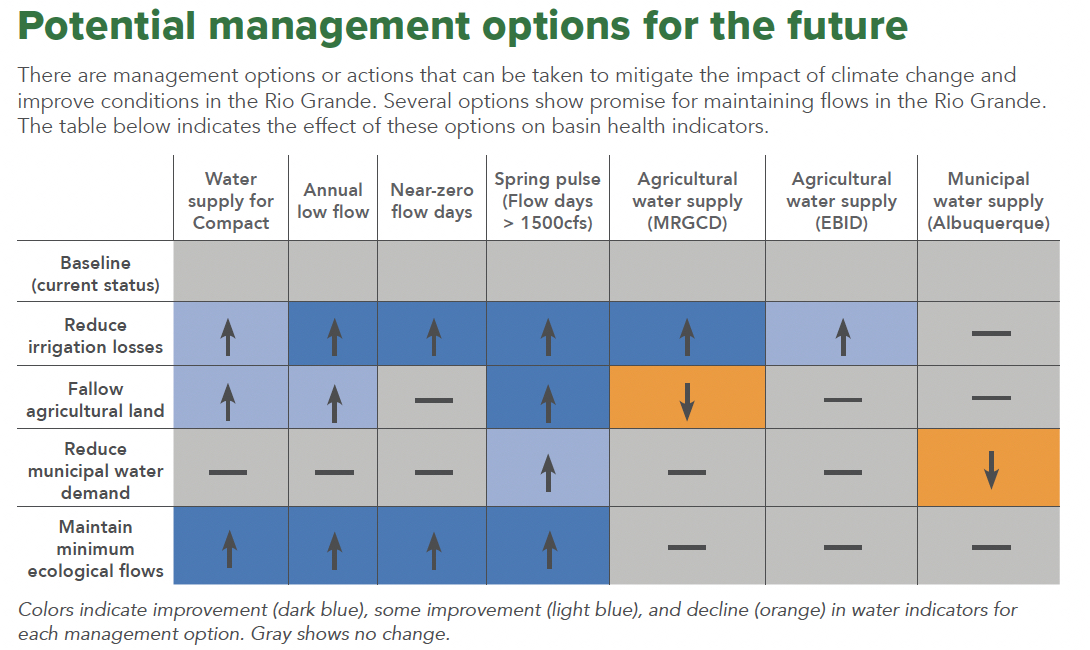
As mentioned earlier, the Upper Rio Grande was the project for IAN where scenario modeling was included in the final report card product. Whereas we at IAN have historically collected and scored data to provide an up to date timestamp of a specific region’s health, for the Upper Rio Grande, our colleagues at the University of Massachusetts Amherst wanted to look at how today’s management systems in the basin would have to adapt in response to future environmental changes. In a nutshell, in what ways would the region’s water resource management have to respond to potential environmental threats? The answers, ie: scenarios, were what we were trying to project out into the future via complex modeling analysis, hence the name scenario modeling.
While one of the major takeaways from the Upper Rio Grande report card is that climate change is currently exacerbating water shortages in the region, the also featured scenario modeling projects that climate change will continue to increase temperatures along the Upper Rio Grande, causing surface water and reservoir inflows to dramatically diminish without adapting management strategies. The report card provides more information detailing how specific policies can adapt to ecological changes, but four major recommendations highlighted in the report card are a direct result of scenario modeling outputs: reducing irrigation losses, fallowing agricultural land, reducing municipal water demand, and maintaining ecological flows.
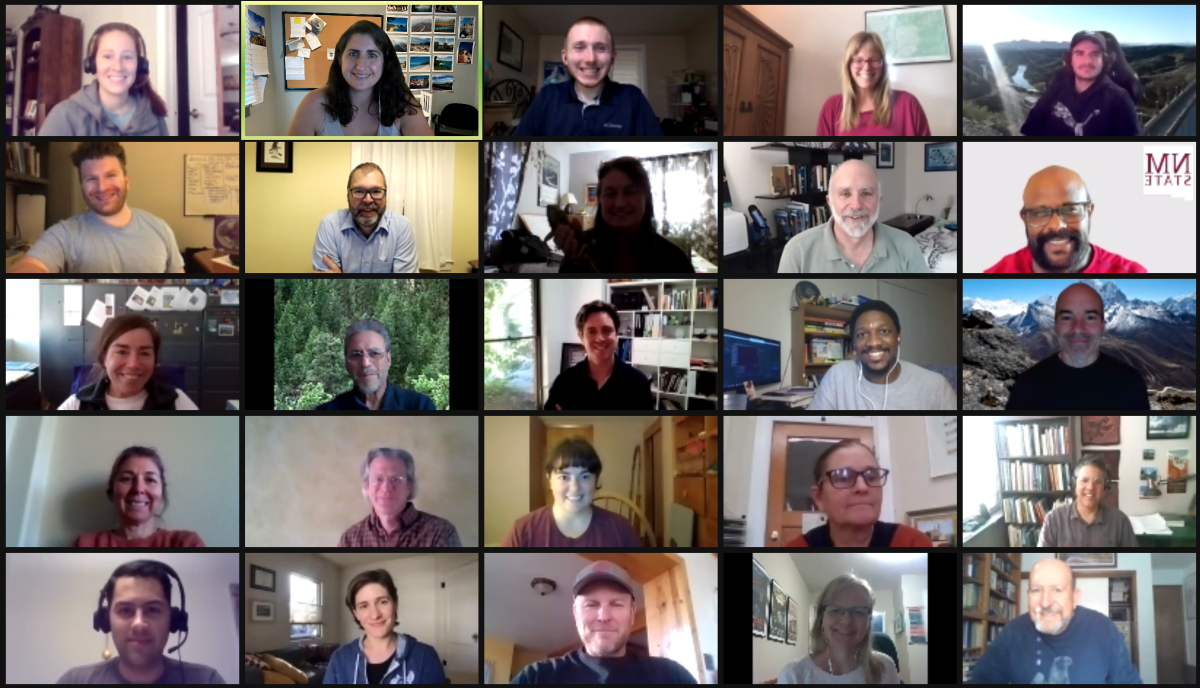
Finally, it cannot be overstated how dramatically the COVID-19 pandemic changed the process in which we at IAN produce report cards. As an organization, we have prided ourselves on our ability to build working relationships with stakeholders from all walks of life from across the globe, and a major component of that ability to build relationships has been meeting stakeholders where they are, in their hometowns, in person. It gives us the opportunity to both work with our partners in professional settings as well as socialize, the latter of which allows for a more informal, and at many times jovial, exchange of information that has been critical to gaining new perspectives as well as trust. The first two years of the pandemic obliterated any opportunity for in-person socializing, and considering how ubiquitous the term “Zoom fatigue” became after March 2020, no one involved on the Upper Rio Grande project was keen to the concept of Zoom happy hour.
Nevertheless, we adapted. We converted what would be a two-day long stakeholder workshop into four 90-minute sessions to gather valuable information and prevent the aforementioned Zoom fatigue. The core team of IAN, UMass, WWF, and Audubon staff met weekly to share updates and maintain transparency. We worked diligently to ensure to demonstrate to partners across the country, of whom we had only met from the shoulder up, that despite the distance, we were still just as invested in these relationships, and because of that open communication, diligence, and determination, we were able to produce a report card remotely.
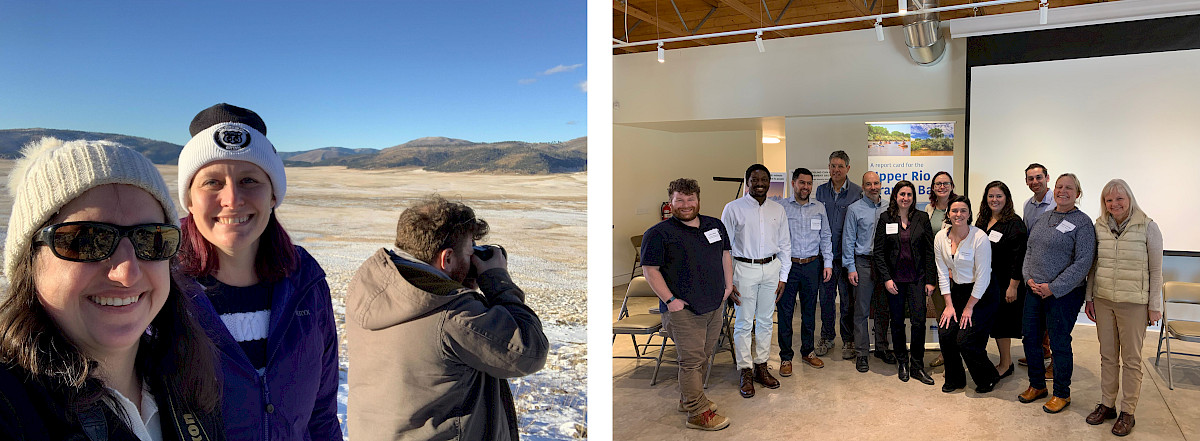
So the IAN team did learn to produce a report card completely remotely, a valuable skill that I hope never atrophies. That being said, we did get to travel to New Mexico for the in-person launch event for the Upper Rio Grande Report Card, and the trip was awesome. We finally got to meet our partners in person. We got the chance to explore Sante Fe together, to talk shop over dinner, and celebrate this publication at an event with an actual audience!
Part of the challenge/excitement of working at IAN means that you might have to work on anything, anywhere, under a variety of circumstances. We are more than capable of producing good work beyond the arm’s length of our colleagues, but if there’s a chance we can work together under the same roof over a cup of coffee, well, then the first round of lattes is on me.
About the author
Nathan Miller

Nathan Miller received his BFA in film and television from New York University and his Masters at Duke University, where he studied coastal environmental management as well as environmental education. For his master's project at Duke, he developed an environmental interpretation manual for seal naturalists in New England. Since coming to the Integration and Application Network (IAN), Nathan has developed environmental health report cards and led or co-facilitated multiple courses on data interpretation and science communication. Scientists, managers, and students of all experiences enroll in these courses in order to gain a foundation in multimedia and storytelling strategies, which in turn helps make complex data more accessible to the general public. Nathan has also co-developed courses in collaboration with the Arnold School of Public Health at the University of South Carolina that teach graduate students how to develop stakeholder driven research projects.