The Keeling Curve: Atmospheric carbon dioxide concentrations as measured at Mauna Loa Observatory. Source: Wikipedia.

Visual science communication: Using data visualization, conceptual diagrams and photographs to convey science information

Bill Dennison · Science Communication | 

Science communication using visual elements can convey unambiguous information that words cannot. Words are often used by lawyers and journalists to argue cases or make points - science is an attempt to base arguments on all the facts available, not just the 'convenient' facts used to support an argument. Words can be interpreted in a variety of ways, but data is less ambiguous.

Map of the Gulf Stream by Benjamin Franklin, 1770.

Ten classic scientific maps

Bill Dennison · Science Communication | 

A well conceived and creatively constructed map can elucidate scientific concepts and effectively communicate important concepts. There are many examples of beautiful maps focusing on various geographic features, but this collection of classic scientific maps is notable for the scientific meaning that they convey. They are presented in chronological order. 1) Gulf Stream:

Looking across to Cincinnati from the Roebling Bridge.

Roebling Bridge in Cincinnati--the predecessor to the Brooklyn Bridge

Bill Dennison · Science Communication |     2 comments

We had beautiful views of the Roebling Bridge from our workshop developing a Mississippi River report card in Covington, Kentucky. After the workshop was over, Bill Nuttle and I walked across the Roebling Bridge from Kentucky to Ohio. The Roebling bridge was built during the Civil War and completed in 1866. At this time, it was the longest suspension bridge in the world, although now there are 121 longer suspension bridges in the world.

Enjoying the river views.

Developing a Mississippi River report card: Ohio River workshop in Cincinnati

Bill Dennison · Science Communication | 

A large IAN contingent gathered along the banks of the Ohio River for the second in a series of workshops designed to develop a report card for the Mississippi River. Heath Kelsey, Bill Nuttle, Caroline Wicks, Brianne Walsh and I collaborated with our colleagues at America's Watershed Initiative to run a workshop in a Covington, Kentucky hotel with fantastic views of the Ohio River, with the Cincinnati skyline as a backdrop.

House of Sweden on the Potomac River, Washington D.C.

The Economics of the Ocean: Discussing the Baltic Sea and Chesapeake Bay at the House of Sweden

Bill Dennison · Science Communication | 

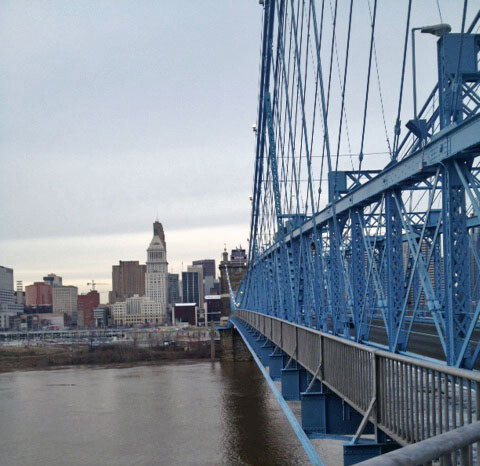
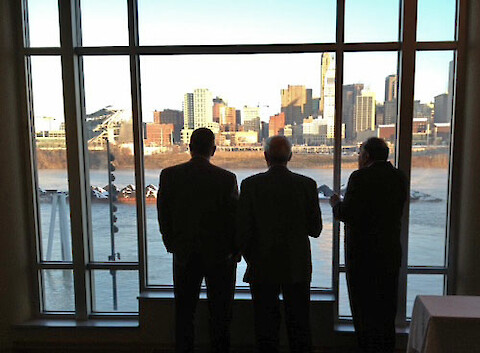
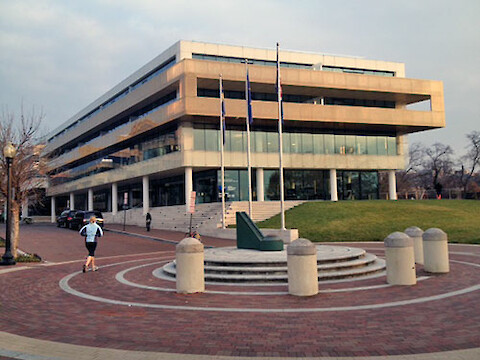
The Swedish embassy organized a two day conference, "The Economics of the Ocean", which occurred at the House of Sweden, located at the confluence of Rock Creek and the Potomac River. The House of Sweden conference room was all windows, with superb views of the Theodore Roosevelt Bridge, the Francis Scott Key bridge, Roosevelt Island, Kennedy Center, and the Watergate Hotel.

Master plan to protect and restore Louisiana's coast. Credit: Coastal Protection and Restoration Authority

Design Competition Stimulates Communication on Multiple Channels

Bill Nuttle · Science Communication | 

The Changing Course competition will stimulate discussion about the future course of the Mississippi River near its mouth. Large areas of wetlands have converted to open water in the delta of the Mississippi over the past 30 years. A changing climate and accelerating sea level rise are expected to make the problem of land loss worse and increase impacts on coastal communities.

Wild & Scenic Film Festival poster.

Wild & Scenic Environmental Film Festival

Bill Dennison · Science Communication |     1 comments

I attended a fundraiser event, sponsored by the Midshore Riverkeeper Conservancy at the Avalon Theatre in Easton Maryland on 22 November. The Wild & Scenic Film Festival was started in 2003 by a watershed advocacy group based in California, the South Yuba River Citizens League. This group holds an annual three day event in Nevada City, CA, but then sponsors a one night festival which has spread to over 100 communities nationally.

Constellations visible in the Northern Hemisphere. Credit: NASA

Ten classic conceptual diagrams: Powerful examples of communicating knowledge

Bill Dennison · Science Communication |     1 comments

Classic conceptual diagrams are those 'thought drawings' that have been judged over time to be effective ways to communicate knowledge. Classic diagrams are emulated repeatedly and appear in text books and in popular media. In order to select a diverse top ten list from many worthy candidates, I selected a representative diagram from different fields of study. The list is presented in chronological order, with the first conceptual diagrams at the beginning of the list. 1. Astronomy:

Randy Olson (left) and Bill Dennison (right)

Presentation dialog

Bill Dennison · Science Communication |     1 comments

Bill has important scientific data AND it is highly relevant BUT he is boring the audience THEREFORE Randy interrupts to improve Bill's presentation... Following the science communication session at the CERF 2013 conference, I was inspired to write this script of an imaginary conversation between me and Randy Olson.

David Balcom, Tom Miller, Bill Dennison and Dave Nemazie (left to right) addressing the attendees at the UMCES party.

UMCES Soiree at CERF 2013

Bill Dennison · Science Communication | 

For the past 7 CERF conferences, UMCES has held a mixer for current and past UMCES faculty, students and staff. It has proven to be a very nice event to reconnect with a variety of people who have the common UMCES lineage that have gathered together at these biennial conferences held in different locations around the country. David Balcom, Tom Miller, Bill Dennison and Dave Nemazie (left to right) addressing the attendees at the UMCES party.