Report cards aren’t just for school anymore
Rebecca Wenker, Wilmelie Cruz Marrero · | Environmental Report Cards | Science Communication | 10 commentsRebecca Wenker and Wilmelie Cruz Marrero
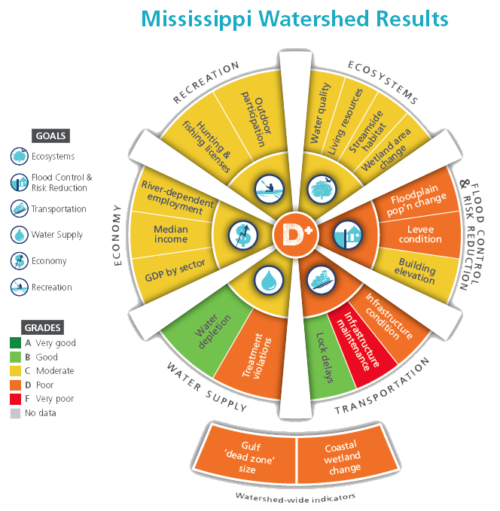
After spending a few classes discussing what coupled systems actually are, how they are created, used, managed, and maintained, and various examples of successes and failures, this week we moved onto a topic that has long struck fear into the hearts of students - assessment. More specifically, we delved into how to evaluate coupled systems based on the assessment of their natural and cultural resources. One of the more common ways to do this is through a report card. Report cards provide numeric or letter grades that represent the health of a geographic region or component of a system, whether it’s looking at ecological, social, or economic health (or some combination of the three). They are very useful in that they are able to incorporate a wide range of data types and sources into overall scores that are easy to relay to policy-makers and the public. A well-known example of a widely used report card is the annual Chesapeake Bay Report Card, developed by our very own Dr. Dennison.
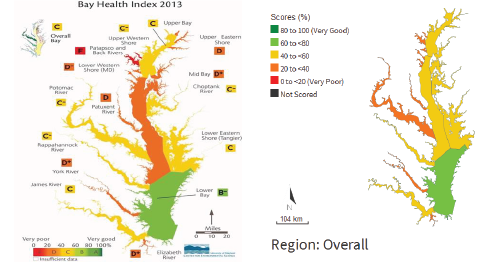
To assess a system, evaluators must:
- Create a conceptual framework/snapshot of our system
- Choose indicators
- Define thresholds
- Calculate scores
- Communicate results
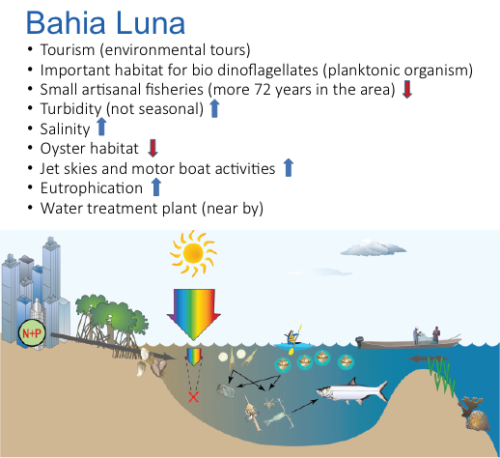
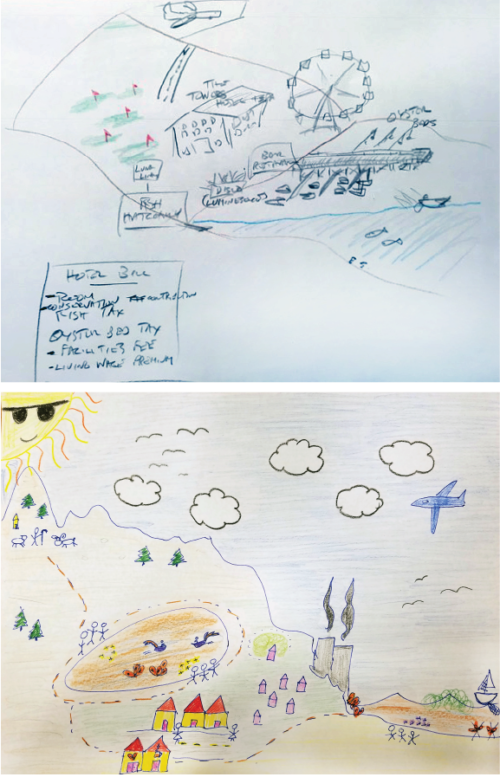
As a class we went through a simulation of this process and learned that although there are only five steps, they are deceptively simple! Wilmelie introduced us to the Bahia Luna system, a bay that draws in a lot of tourism and business due to its oysters, fisheries, and bioluminescent dinoflagellates. We were divided into three stakeholder groups– Business, Community, and Scientific – and told to create conceptual diagrams highlighting what to focus on in regards to this system’s future while taking into account the system trends (seen below). These groups were comprised of a wide selection of people with different interests, so unsurprisingly their focuses varied. There was somewhat of a shared interest in ecosystem health, but this interest was for different reasons and to different extents. For example, though both the scientists and businesspeople were concerned with a decrease in water quality, the scientists were concerned about overall ecosystem health whereas the businessmen were concerned with the success of their local Luminescence Beach Bar.
The difference in focus between the stakeholder groups was even more evident when we were told to choose indicators for system health. While the scientists focused solely on ecosystem indicators such as water quality measurements and organism counts, both the business and community groups added economic and social components. Socially, the business group was concerned with visit satisfaction, repeat customers, and job satisfaction, while the community group wanted to look at the amount of public vs. private space, native happiness index, satisfaction index, and the sales and membership of the women’s and homeowner’s group. Economically, the business stakeholders valued tourism revenue, profit analysis, and infrastructure maintenance. Similarly, the community stakeholders’ economic indicators included tourism revenue, local business profit, and income of residents. Overall, in selecting these indicators it was key that they represented change over time, and that they could show general trends.
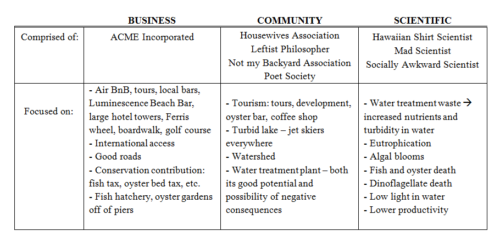
Interestingly, both the community and business groups discussed how it was more challenging to identify a proper social indicator versus an economic or ecological one. We decided that cultural indicators are inherently hard to measure. For example, you can easily count dinoflagellates under a microscope but you cannot as easily measure the productivity of community engagement. However, social indicators are just as important as the other two, and it is critical that they are not overlooked. The health of a system is going to vary based on who is involved, and the interests they have. Different people measure the health of the system in a different way, and to not take into account what is essential to them is to risk the success of the entire monitoring and management of the system.
As if choosing our original indicators wasn’t difficult enough, we were then told to narrow them down to our top two choices to propose to management, which must take into account indicators from all three stakeholder groups. After this, we discussed if management should weigh them equally or differently. We realized, somewhat belatedly, that we forgot to do something very important at the beginning of this whole process –create goals for the system. In creating goals, we help to shape the framework for our desired system. However, this was more easily said than done, due to the divergent goals of each of the three stakeholder groups, and a number of questions that were generated in the goal making process.
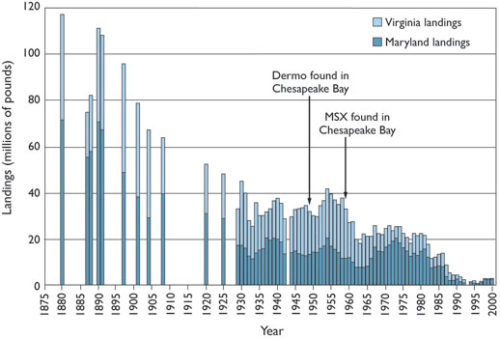
One of the main questions we grappled with was what is the desired state of the system we want, and what is already degraded? As seen by a number of ecosystems, (i.e. coral reef systems overgrown by algae) plenty of life can be present, but it may not be the type of life we desire. At this point in history, all ecological systems are somewhat managed. Should we focus on making them productive for our means, or on returning them to the state before we intervened? This brings into play the idea of “pristine nature,” an ideal ecosystem untampered by modern society. However in reality, is an exact pristine nature achievable or is it solely a cultural idea? How far back in time do we want to restore our environment to? Before Western intervention, before Native American intervention? These questions are difficult to answer, and there remains the possibility that our modern systems could be negatively affected by returning to our idea of “pristine nature” of years past. For example, if oyster reefs today were as high and plentiful as they were when John Smith explored the Chesapeake Bay, they could impair our current navigation of its waterways.
Ultimately, we decided that to mitigate the different goals and environmental perspectives people have, there must be compromise, flexibility, and a voting system installed. If we find where our goals overlap, it may make it easier to create common goals for the whole system. The desired system state must be representative of the entire community, so the people voting on which indicators to use must be comprised of who the assessment is intended for. This will inform who is invited to individual meetings developing indicators, and how they proceed from there. Some of us mentioned that there should be a weighted voting system, where people who  are more knowledgeable about certain subjects have a higher weight on the vote concerning that indicator.
Finally, when creating these report cards it is vital that we are transparent in our actions, and about how and why we did them. Remember, whatever system we create is not perfect, so hopefully a report card and our own capability of change can improve future management.
References:
- America’s Watershed Initiative. 2015. “Mississippi River Watershed Report Card" (On-line), America’s Watershed Initiative. Web. Accessed February 26, 2017 at IAN Press
- Longstaff, B.J., Carruthers, T.J.B., Dennison, W.C., Lookingbill, T.R., Hawkey, J.M., Thomas, J.E., Wicks, E.C., and Woerner, J.L. 2010. Integrating and Applying Science: A practical handbook for effective coastal ecosystem assessment. IAN Press, Cambridge,MD. Chapter5: Ecological indicators.
- Longstaff, B.J., Carruthers, T.J.B., Dennison, W.C., Lookingbill, T.R., Hawkey, J.M., Thomas, J.E., Wicks, E.C., and Woerner, J.L. 2010. Integrating and Applying Science: A practical handbook for effective coastal ecosystem assessment. IAN Press, Cambridge, MD.Chapter 6: Ecological report cards.
- University of Maryland Center for Environmental Science. 2017. “Chesapeake Bay Report Card” (On-line), Eco Health Report Cards. Web. Accessed February 26, 2017 at https://ecoreportcard.org/report-cards/chesapeake-bay/
Additional reading on selecting social and cultural indicators, and report cards:
- Pascoe, S., Tobin, R., Windle, J., Cannard, T., Marshall, N., Kabir, Z., et al. 2016. Developing a Social, Cultural and Economic Report Card for a Regional Industrial Harbour. PLoS ONE 11(2): e0148271. doi:10.1371/journal.pone.0148271
Next Post > Ecodrought on the east side of the Pacific Northwest
Comments
-
Suzanne Spitzer 9 years ago
Outwardly, during our class activity, it appeared as if the scientists were the only group truly advocating for an emphasis on environmental indicators for our Baia Luna Report Card, but when you dig a little deeper you can see that this was not the case at all. As this blog points out, although our main goals and priorities were different, we found that it was in everyone’s best interest to protect the environment because a healthy environment helped us to reach our respective desired states—healthy water quality for the scientists, a successful local Luminescence Beach Bar for the businesspeople, and a thriving sociocultural landscape for the local citizens.
As an environmentalist and an environmental scientist, I would absolutely love it if everyone cared as much as I do about the environment and worked hard to protect it from degradation. I can only imagine how much progress we could make towards building a sustainable future if that were the case. Unfortunately, this will likely never be the case—people care about different things and have different interests, and it is just a fact that not everyone has passion for nature or recognizes the intrinsic value of our natural environment. In light of this, perhaps we, as scientists, need to amend our communication strategy with the public. Instead of explaining to non-scientists why they should care about the environment in terms of our own scientific or personal goals, we could emphasize where our goals overlap with theirs and point out how collaborating to protect the environment could benefit all parties involved in various ways. As long as the water is protected, do scientists need to bemoan the fact that many businesspeople might only be in it for the money they make off their Bioluminescence Bar, or can we just celebrate the fact that we have a new partner in environmental protection? -
Kelly Hondula 9 years ago
The report card approach seems to be a blend of two different but related frameworks for studying socio-environmental systems - "ecosystem services" and "coupled human and natural systems". The perspective of starting with the idea of a system and then choosing indicators reflects this - an acknowledgement of the inter-relatedness and spatial/temporal interdependencies of a connected system, but with a focus on those elements that provide value to humans. Although the dependencies between indicators is inherent to their evaluation, the way that there may be tradeoffs or synergies (eg that are unexpected, or may have lag times) between different parts of the system is an interesting avenue to explore. I found it interesting that the original diagram of the system contained linkages and flows, for example in the food web, whereas the conceptual diagrams developed by the groups seemed to represent more static snapshots without explicit flows represented.
-
David Miles 9 years ago
I think the biggest hurdle to our little simulation, and real world scenarios is who has the final say. There will be differences of opinion--from who gets a seat at the table, to what indicators to choose, on how to improve grades, and which grades to improve first-- and navigating those conflicts is what I believe is the biggest challenge to the report card concepts, much the same way it is the biggest challenge for managing coupled systems without report cards. On some level, some stakeholders opinion will override another or be considered more important. Perhaps there should be an independent body, or group that should act as an arbitrator for the whole process.
-
Killian F 9 years ago
Reading Krystal’s comment really made me think about how impossible it would be for humans to get the earth back to what it was like before humans changed so much of it. Humans have had such a huge effect on the Earth, so much that we may have even brought the Earth to a new geological era, due to extinctions of mega fauna and such vast changes to the Earth’s surface. With over seven billion humans spread out into many different environments, attempting to restore ecosystems back to their original states seems almost certain to have a negative impact on at least some people. I agree with Krystal that working towards sustainable systems and trying to preserve the functioning of ecosystems is important, and we must try to balance that with the costs on the people affected. As we have discussed in previous classes though, there are so many connections between systems that it is often difficult to see what widespread effects there can be from a change in what seems to be a small and unconnected area. Communication between scientists of different disciplines and with all kinds of stakeholders is necessary to work towards a sustainable future with the most benefits.
-
Noelle O. 9 years ago
I absolutely agree that the environmentally-conscious folks need to work on translating why the “science” or ecosystem health is important to all stakeholders. And as Suzi said, the business and community groups do care about the environment although it’s not always blatantly obvious. I enjoyed going through the exercise in class and learning about the process of forming the Mississippi River Basin report card through Bill’s Lecture. It boggles my mind thinking about the amount of time and effort required to make a report card which covers such a large geographic area with that many stakeholders!
The discussion about returning to “pristine” ecological conditions reminded me about the concept of shifting baselines. In terms of natural resource management of oysters, at what point do we look back to compare oyster population size? Before industrialization? Right after industrialization? When we first had formal oyster stock assessments? Determining which baseline to use would be an essential step for management when you are first selecting which goals and objective you want to achieve.
-
Krystal Yhap 9 years ago
This was a good blog post that I think really helped to convey the usefulness of the report card system and the challenges that come with having multiple stakeholders with different goals involved in a decision making process. I like the questions that Rebecca poses near the end of the blog post. The idea of returning the ecological system to its state before humans intervened is a thought I, and other I know, grappled with when I first began pursing environmental science as a major during my undergraduate years. The John Smith example was so good because I never thought that by trying to restore nature back to its original form would potentially have a negative impact on humans and the desired life we see for ourselves. I have now come to the conclusion that it would not be possible nor beneficial for us(humankind)to do so. I think working towards a more sustainable system where we protect and enhance the function of ecosystem services. I agree with Suzi that the concept of communication between scientist (or any professionals involved in environmental restoration) and the general public needs to be improved upon. Scientists need to meet the general public where they are in terms of conveying complex scientific information and environmental concepts to them. I also see how important communication and setting goals/having common interests is when different stakeholders collaborate to combat different environmental issues or come up with rules and management plans that work. Choosing the right stakeholders is also important, and I think we saw that in our class discussion.
-
Natalie Yee 9 years ago
I think not setting a goal and establishing communication is a flaw in both our simulation as well as in real life. There are often times groups of people who feel that their viewpoint is not appreciated or taken into consideration when it comes to decision making. Often times it seems that the Business side of things is what takes precedent, and that science or community welfare is not considered. Through the use of report cards, we are able to demonstrate and appreciate these other points of view and connecting them all through a common goal. It is a great tool that not only collects different viewpoints, but also establishes goals and steps forward to help achieve the common goal.
-
V Leitold 9 years ago
I think one challenge in this class exercise was that the three different groups (Business, Community, and Scientists) each started out with a different conceptual diagram of the system, largely based on the general guidelines that Wilmelie provided for Bahia Luna, but specifically designed according to each group’s own imagination. This made the discussion perhaps more difficult than expected, because not only did the three groups approach the questions from three different angles (economic, social, and ecological), but the systems they were referring to were actually three different systems as well (maybe not substantially, but different nonetheless). For a more successful dialogue in the assessment of natural and cultural resources, it might help to bring stakeholders together in the beginning so that they can all agree on a conceptual framework as a baseline for assessment (and also to define clear goals!), and from there, each stakeholder group can focus in on their specific area of expertise, and advocate for indicators that they consider most relevant to include on a report card – this would hopefully ensure that all important aspects of the environment (social, cultural, natural, etc) get communicated to the public in a meaningful way.
-
Rachel E 9 years ago
I agree with Wilmelie that the goal is to portray the science, cultural, economic issues in an environment to people. Choosing indicators is arguably the most important part because these indicators shape the message you are portraying. As Rebecca note, with as many Oyster's as there were in the time of John Smith we would have navigational issues. Does this mean that if we did have that many oysters today the bay would be unhelthy? I had not thought about this untill our class discussion, but the definition and meaning of the word "health" have to do with your personal goals or what you think is important.
I would also like to comment on what Suzy said. I feel the same way; I wish everyone cared about the environment and wanted to preserve it as much as I do. However, I think that sometimes, with the social pressures that we have and other social or economical constraints, people struggle to act in environmentally conscious ways.
We as scientists definitely need to communicate with the public more effectively.
Alternatively, I think we need to make a bigger effort in understanding what drives changes in behavior. Communication is important for making people understand complex issues, but it doesn't necessarily drive changes in behavior.
I recently went to a discussion on renewable energy and one individual made the case that people are motivated by money and a 'responsible government' can act in ways that motivate people to act in sustainable ways, when they otherwise would not. For example, gas prices are low which is a motivation to use this as a fuel source. The american dollar and the euro are similar in value but their gas prices are double or triple ours because of taxes imposed by the government. This motivates people and and provides and incentive for using alternative energy sources. Just a thought I had on communicating with the public and motivating people to act in environmentally conscious ways.Great blog, Rebecca!
-
W.Cruz 9 years ago
Great blog Rebecca!!! I think the main purpose of the report card is to communicate science, cultural, economic issues in an environment. It's main purpose is to make everything easy to understand by anyone and recall on what's needs to be done to improve the conditions. Although as mentioned before somethings are not easy to be measure but that leaves more room for improvement.