Publications about Chesapeake Bay

IAN is committed to producing practical, user-centered communications that foster a better understanding of science and enable readers to pursue new opportunities in research, education, and environmental problem-solving. Our publications synthesize scientific findings using effective science communication techniques.

Eastern oyster (Crassostrea virginica) [delta]15N as a bioindicator of nitrogen sources: Observations and modeling (Page 1)

Eastern oyster (Crassostrea virginica) [delta]15N as a bioindicator of nitrogen sources: Observations and modeling

Fertig BM, Carruthers TJB, Dennison WC, Fertig EJ, and Altabet MA ·

Stable nitrogen isotopes ([delta]15N) in bioindicators are increasingly employed to identify nitrogen sources in many ecosystems and biological characteristics of the eastern oyster (Crassostrea virginica) make it an appropriate species for this purpose. To assess nitrogen isotopic fractionation associated with assimilation and baseline variations in oyster mantle, gill, and muscle tissue [delta]15N, manipulative fieldwork in Chesapeake Bay and corresponding modeling exercises were conducted.

Long-Term Trends in Submersed Aquatic Vegetation (SAV) in Chesapeake Bay, USA, Related to Water Quality (Page 1)

Long-Term Trends in Submersed Aquatic Vegetation (SAV) in Chesapeake Bay, USA, Related to Water Quality

Orth RJ, Williams MR, Marion SR, Wilcox DJ, Carruthers TJB, Moore KA, Kemp WM, Dennison WC, Rybicki N, Bergstrom P, and Batiuk RA ·

Chesapeake Bay supports a diverse assemblage of marine and freshwater species of submersed aquatic vegetation (SAV) whose broad distributions are generally constrained by salinity. An annual aerial SAV monitoring program and a bi-monthly to monthly water quality monitoring program have been conducted throughout Chesapeake Bay since 1984. We performed an analysis of SAV abundance and up to 22 environmental variables potentially influencing SAV growth and abundance (1984-2006).

Long-Term Trends of Water Quality and Biotic Metrics in Chesapeake Bay: 1986 to 2008 (Page 1)

Long-Term Trends of Water Quality and Biotic Metrics in Chesapeake Bay: 1986 to 2008

Williams MR, Filoso S, Longstaff BJ, and Dennison WC ·

We analyzed trends in a 23-year period of water quality and biotic data for Chesapeake Bay. Indicators were used to detect trends of improving and worsening environmental health in 15 regions and 70 segments of the bay and to assess the estuarine ecosystem's responses to reduced nutrient loading from point (i.e., sewage treatment facilities) and nonpoint (e.g., agricultural and urban land use) sources.

Research findings for key bay fisheries species (Page 1)

Research findings for key bay fisheries species

Emily Nauman, Heath Kelsey, Jane Hawkey, Howard Townsend ·

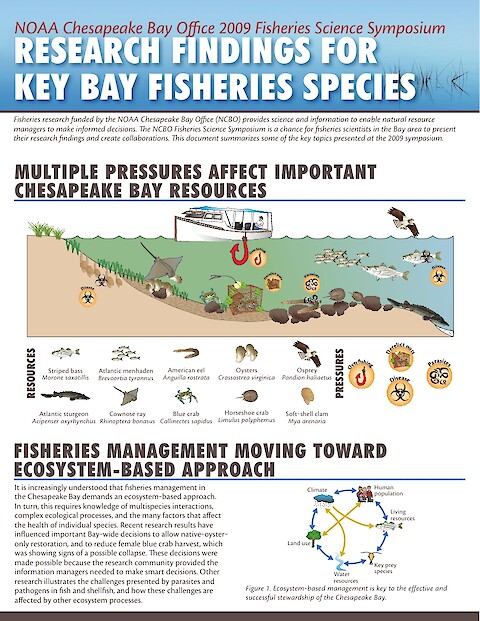
Fisheries research funded by the NOAA Chesapeake Bay Office (NCBO) provides science and information to enable natural resource managers to make informed decisions. The NCBO Fisheries Science Symposium is a chance for fisheries scientists in the Bay area to present their research findings and create collaborations. This document is an EcoCheck/NCBO collaboration and summarizes some of the key topics presented at the 2009 symposium.

2008 Chesapeake Bay Report Card (Page 1)

2008 Chesapeake Bay Report Card

Ben Longstaff, Michael Williams, Caroline Donovan, Emily Nauman, Heath Kelsey ·

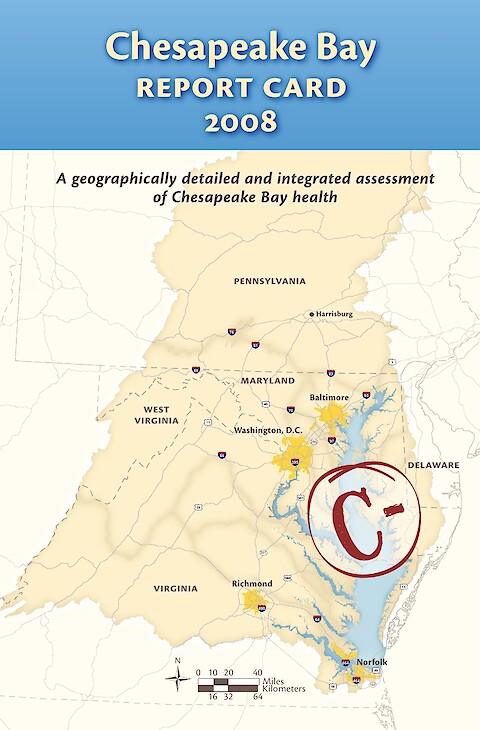
This report card provides a transparent, timely, and geographically detailed annual assessment of 2008 Chesapeake Bay habitat health. This is the third year that the report card has been released. This report card rates 15 reporting regions of the Bay using six indicators that are combined into a single overarching index of habitat health. The overall health of Chesapeake Bay was poor in 2008, obtaining a grade of C-.

New Stream Health Indicator Being Developed (Page 1)

New Stream Health Indicator Being Developed

Katie Foreman, Caroline Donovan, Emily Nauman, Bill Dennison ·

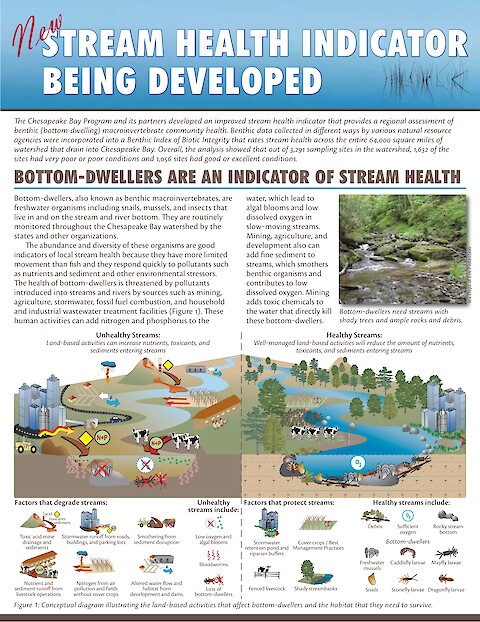
The Chesapeake Bay Program and its partners developed an improved stream health indicator that provides a regional assessment of benthic (bottom-dwelling) macroinvertebrate community health. Benthic data collected in different ways by various natural resource agencies were incorporated into a Benthic Index of Biotic Integrity that rates stream health across the entire 64,000 square miles of watershed that drain into Chesapeake Bay.

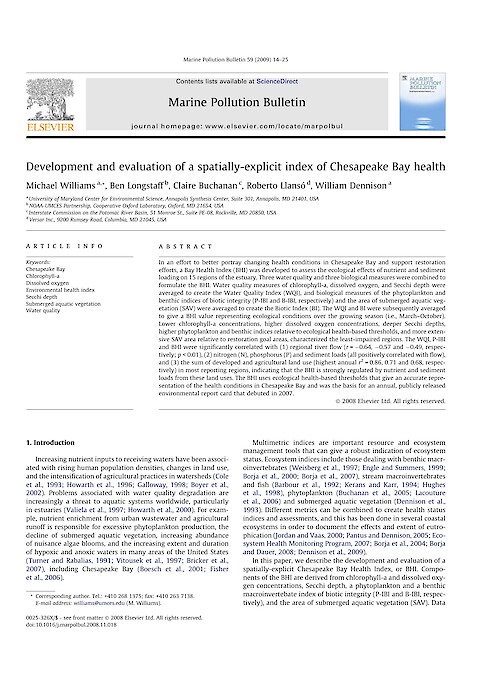
Development and evaluation of a spatially-explicit index of Chesapeake Bay health (Page 1)

Development and evaluation of a spatially-explicit index of Chesapeake Bay health

Williams MR, Longstaff BJ, Buchanan C, Llanso R, Dennison WC ·

In an effort to better portray changing health conditions in Chesapeake Bay and support restoration efforts, a Bay Health Index (BHI) was developed to assess the ecological effects of nutrient and sediment loading on 15 regions of the estuary. Three water quality and three biological measures were combined to formulate the BHI.

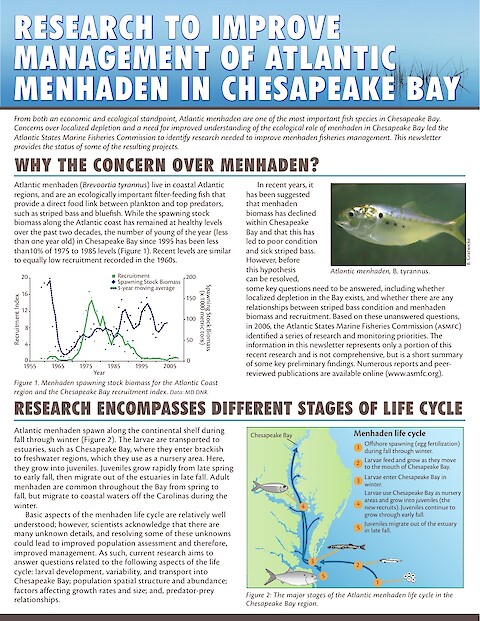
Research to improve management of Atlantic menhaden in Chesapeake Bay (Page 1)

Research to improve management of Atlantic menhaden in Chesapeake Bay

Ben Longstaff, Caroline Donovan, Emily Nauman ·

From both an economic and ecological standpoint, Atlantic menhaden are one of the most important fish species in Chesapeake Bay. Concerns over localized depletion and a need for improved understanding of the ecological role of menhaden in Chesapeake Bay led the Atlantic States Marine Fisheries Commission to identify research needed to improve menhaden fisheries management. This newsletter provides the status of some of the resulting projects.

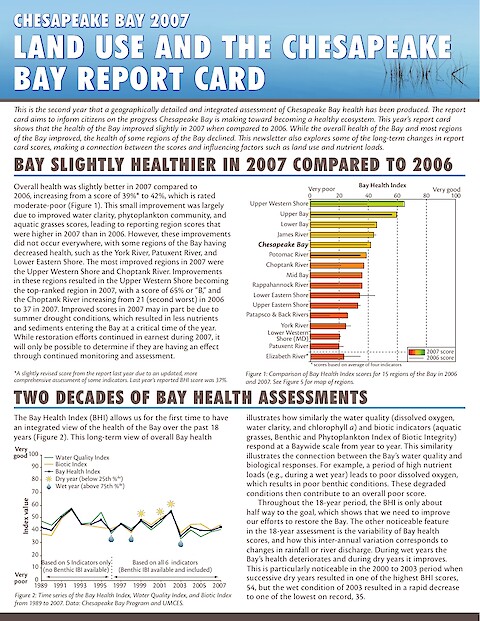
Chesapeake Bay Health Report Card: 2007 (Page 1)

Chesapeake Bay Health Report Card: 2007

Ben Longstaff, Caroline Donovan ·

This report card provides a transparent, timely, and geographically detailed annual assessment of 2007 Chesapeake Bay habitat health. This is the second year that the report card has been released. This report card rates 15 reporting regions of the Bay using six indicators that are combined into a single overarching index of habitat health. Habitat health is defined as progress of the six indicators towards established scientifically derived ecological thresholds or goals.