2017 Chesapeake Bay report card release
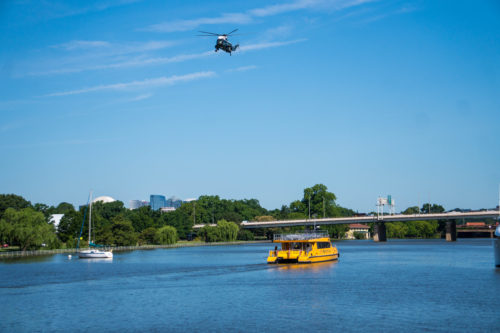
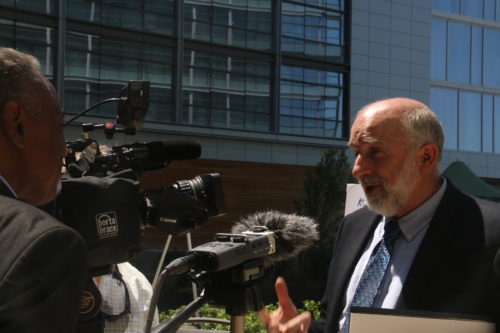
Bill Dennison ·We held a press conference for the release of the 2017 Chesapeake Bay report card on 15 June 2018 on the Potomac River. We used the Hyatt Hotel as the press conference venue in a new development on the Wharf area of Washington, D.C. It was a great venue in that it showcased the social and economic opportunities that a clean waterway can afford. There were new water taxis plying the river, floating wetlands alongside a nice pier, and lots of restaurants and pubs along the waterfront. They were preparing for a JazzFest that night and there were a lot of people walking along the riverfront. We worked with Mike Smith’s excellent team from GreenSmith again to help disseminate the report card.
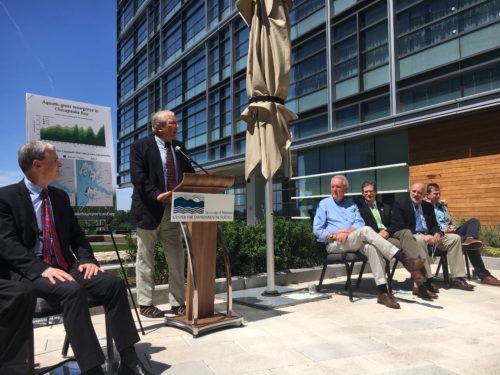
Peter Goodwin, President of the University of Maryland Center for Environmental
Science opened the event, followed by Tommy Wells (Director, Department of Energy
and the Environment, District of Columbia), Ben Grumbles (Maryland Secretary of
Environment), Mark Belton (Maryland Secretary of Natural Resources), Matt Strickler
(Virginia Secretary of Natural Resources), and Jake Reilly (Program Director,
Chesapeake Bay, National Fish and Wildlife Foundation).
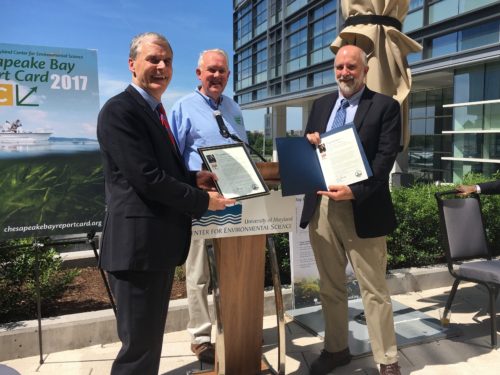
Tommy Wells presented the University of Maryland Center for Environmental Science (UMCES) with a citation from the Mayor of the District of Columbia, Muriel Bowser, for our report efforts, which was very nice to receive. Secretary Ben Grumbles mentioned that UMCES served as valued advisors for impartial advice to government, but Secretary Mark Belton used the term trusted partner. When my turn to speak came along, I agreed with Secretary Belton’s term, since I feel as though we are working hand-in-hand with the agencies in a partnership to restore the Bay. It was nice to have Matt Stickler from Virginia Department of Natural Resources mention similar things about the Virginia Institute of Marine Science, since my friend and colleague Bob “JJ” Orth also spoke at the press conference about the resurgence of aquatic grasses in the Bay.
In unveiling the 2017 Chesapeake Bay report card, my remarks were as follows:
“Thank you all for joining us today for the release of the 2017 Chesapeake Bay report card. It is wonderful to be standing alongside this magnificent tributary of Chesapeake Bay, the Potomac River, to deliver this message of hope and inspiration for the restoration of Chesapeake Bay. Our nation’s capital was founded at the junction of the famous Potomac River and the forgotten river, the Anacostia. Both of these rivers derive their names from the original inhabitants of this region, the Native Americans. It is gratifying that today we can report to their descendants that we have finally reversed the course of degradation for the Bay.
As Peter Goodwin mentioned in his opening remarks, this is the twelfth year that we have released the Chesapeake Bay report card. But because the Chesapeake Bay Program partnership has been conducting regular scientifically rigorous monitoring for over 30 years, we have also been able to calculate report card scores since 1986. This has given us the ability to calculate long term trends in the various indicators that comprise the report card scores. This trend analysis is an important part of today’s report card release.
The big story this year is encapsulated by the upward arrow for the overall trajectory of Chesapeake Bay report card scores. What this arrow represents is the statistically significant upward trend in the overall health index. This means that the overall Bay is getting healthier, in addition to the improving trends that we have seen in the various reporting regions. This year, as last year, we calculated improving trends in 7 of the 15 reporting regions. But what is different this year is that the overall Bay health index, encompassing data from the entire 15 reporting regions, is now improving.
This year’s overall score is similar to the last 3 years, and these high scores have served to create the overall positive trend. We have been watching this trend closely, and for the last two years there was a slightly improving trend after years of slightly degrading trends. But this year’s score helped make this slightly positive trend into a statistically significant positive trend. This is really exciting. It confirms the visible signs that we have been seeing, like dolphins appearing throughout the Bay and the record aquatic grass cover that my colleague Bob Orth will be talking about later. It also represents the things we cannot easily see like the nutrient reductions and shrinking dead zones.
We have a few things that we are recommending that people can do to help improve the rivers and Bay. Plant a tree this year. Here in the city, urban trees help intercept rainwater and avoid flashy runoff, they cool the sidewalks and streets and urban trees in Baltimore has been shown to be correlated with lower crime rates. We also encourage everyone to talk with others about your steams, rivers and the Bay. We need to engage more people in this journey of improving the Bay. And to our resource managers and decision makers like Tommy Wells, Ben Grumbles, Mark Belton and Matt Strickler here today, we thank you for your consistent support for using science in your programs and we encourage you to convince your colleagues in the other watershed states to emulate your science-based decision making.
Native Americans inhabited the Chesapeake region for millennia without significantly degrading the Bay, but when John Smith sailed into the Bay over four hundred years ago, things began to change. Forests were removed to make way for crops, animals, roads, houses and cities. Here in the Potomac and the Anacostia Rivers, raw sewage fouled the water and algal blooms discolored the water. But state-of-the-art sewage treatment facilities, in particular, the largest advanced wastewater treatment plant in the world, Blue Plains Advanced wastewater treatment plant, have reduced nutrient loading. The massive stormwater tunnels being constructed are tackling the tough issue of treating stormwater. Just outside this venue, you can see floating wetlands, designed to absorb nutrients. These measures mean that the upward trend for overall Bay health will likely lead to improving scores even in our most challenged tributaries like the Potomac and Anacostia. There is indeed cause for optimism in these rivers as reported by the Potomac Conservancy. We look forward to when we can report improving grades for the Potomac River.
Finally, we are entering an exciting new phase of the Chesapeake report card development, which Jake Reilly from the National Fish & Wildlife Foundation highlighted. We will be expanding the scope of our report card in two ways. We will expand the types of indicators, incorporating social and economic indicators and we will expand our geography to encompass the vast Chesapeake watershed. We believe that expanding the report card in these ways will help Chesapeake residents better connect with the Bay and lead to behavior changes that ultimately improve the health of the Bay and its tributaries.”
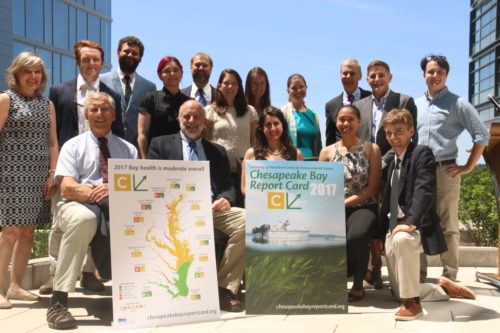
Following the report release, we continued our tradition of having the Integration and Application Network go out for margaritas. There was a nice Mexican restaurant, Mi Vida, along the waterfront with fantastic margaritas and nachos. It gave me a chance to acknowledge the tremendous efforts by the IAN team in producing the report card. Just about everyone was involved, but some notable efforts included Dylan Taillie for the data analyses and content production, Alex Fries and Caroline Donovan for the agency liaison and data acquisition, Emily Nastase for the report card and poster design, and Jamie Currie and Sky Swanson for the video production and editing. Brianne Walsh and Kiri Carini helped from afar with the social media.
The best part of the report event was to be able to see our team all dressed up and celebrating together. It reminded me of how very fortunate I am to work with such talented, fun and passionate people. Launching the report card, especially with good news to share, turns out to be a highlight of the year.
About the author
Bill Dennison

Dr. Bill Dennison is a Professor of Marine Science and Vice President for Science Application at the University of Maryland Center for Environmental Science.
Next Post > Local solutions: collaborations and information sharing to grow passion and facilitate community change
Comments
-
James Mbewe 6 years ago
Hi Bill, This is great work. i would love to join this profession of producing report cards. I am so much in love with both aquatic and terrestrial ecology. I have BSc in Wildlife Management from a government institution called Copperbelt University and i graduated on 31st August, 2017. It would be great for me to pursue a Masters program in this profession of producing report cards so that i can take up the duty you started of producing report cards in Africa. I am currently the main guy doing data collection for Kafue Basin Health Report Card under WWF support by DR. Simon Constanzo and Dr. Health.

