Bill Dennison speech to Latornell conference, Ontario, Canada: Part 5 - Report card examples
Bill Dennison · | Environmental Report Cards | Science Communication |PART 5; Report card examples
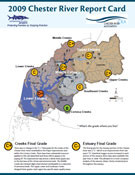
Another aspect that I think has a lot of similarities to Ontario right now with your thirty-six conservational authorities doing these Report Cards, is that first in some areas where you don't have a lot of resources, that citizens and scientists become a really powerful tool. And we've developed a coalition around these citizen and scientist groups. An example is the Chester River, and citizen science group call themselves the Chester Testers. There are eighty to a hundred of these volunteers that go out and collect water quality, then send it to the appropriate labs, or do the analysis that they can right there. It turns out that a lot of these river or water keeper groups are doing things like that. But, they were doing all kinds of different techniques, different indicators, different thresholds, and you really couldn't even compare their data. So what we did is we got them together and said, "We're going to have a set of six core indicators that everybody measures them the same way with the same thresholds. And then you have elective indicators; you can do whatever you want. If you want to worry about yellow perch, worry about yellow perch. But, they won't count in the comparative report card here. They wouldn't be a part of the Report Card." So that's conservation that Conservation Ontario and colleagues could think about, core indicators and electives.
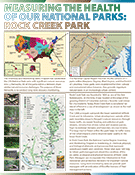
I also think that you can use indicators for any habitat type. So my colleague at the Integration and Application Network, Tim Carruthers, has been working with the National Park Service in the Pacific Ocean and in the National Capital Region primarily. An example is an urban park in Washington, D.C., called Rock Creek, the second oldest National Park in the country. It's near Georgetown and the Potomac River. Teddy Roosevelt used to ride his horses through there. It's got a lot of forest. It's really a forested park. And what you see here is the degraded forest with alien species and impervious surfaces, defoliation, and way too many deer. It's not cool to hunt deer (or people) in downtown D.C, and the desired state, is to have biodiversity and good forest cover. So what we did with the Park Service staff by having them help us draw a vision of degraded versus desired conditions. And then we chose a suite of indicators through the National Park Service Vital Signs Monitoring Program, which was created in the mid-1990s when Congress asked, "How are the Parks doing?" And the Park Service Rangers said, "We don't know." Then Congress said, "Go back and find that out." So they created this Vital Signs Program. They've been measuring a bunch of things. We had density of exotics, presence of insect paths, presence of forest dwelling bird species, the over population of deer, native seedling regeneration, forest connectivity and percent impervious. So each of these has a set of metrics that go with it so we can then one by one go through and establish whether or not that forest is in good shape. Similarly, we can do that with any other habitat type. This Park only had three habitat types, but the Assateague National Seashore we're working on has seven or eight different habitat types. For the Wetlands, we had phosphorus, salinity, nitrate, and dissolved oxygen indicators. Then the invertebrates, amphibians, and some physical habitat index. So the point is, if you establish the desired vs. degraded features using our conceptual diagram approach, you can create a suite of indicators and track the progress that you're making along a spectrum of degraded to desired conditions.
I can sense that you're onto the 'stating' approach in Ontario and I've seen this happening in America and Europe and Australia, where 'stating' is an increasingly popular approach to governance. This is kind of a new term that came out of a thing that Governor O'Malley, who as the Mayor of Baltimore called "CityStat." He used it to fight crime and fill potholes. Then he realized that was good for every social service, so he applied it across the board. It came from New York City. And New York City started it for crime in the mid '90's, and Toronto is using it. I got onto your Toronto website, and the crime stats are mapped. The gunshot incidents last year and the stats associated with it are plotted on a map. It's being used by Governments all around the world, typically starting with crime or basic social services, but it can be applied environmentally as well.
The other thing that's important is that we've gone from the era of simple point-source-pollution, to diffuse sources. So we need a map. We need geographic references to these environmental problems. The other thing that's really important, is what I call the "Observation Revolution." We are now increasing our sensor technology, both in the sky and in the water or on the land. We're telemetrying the world. The amount of data flow that we're getting is exponentially increasing. In Chesapeake, we generated about ten million data points last year. And it's mostly because we can put eyes in the sky, and we can put continuous monitors into the water. And the data gathering capacity just goes through the roof. But it doesn't make any sense with all data if you're trying to get a drink out of a fire hose, if the data represents water coming through the fire hose, increasing the size and pressure of that fire hose doesn't get you any more water to drink. In fact, it makes it even harder. So what we're trying to do with Report Cards is figure out a way to tap that torrent of data.
This is the fifth post in a series about Bill Dennison's keynote address at the Latornell conference in Toronto, Ontario, Canada.
Other posts in this series:
1. Part 1 - Science Communication
2. Part 2 - Incorporating visual elements
3. Part 3 - History of Science Communication
4. Part 4 - Environmental Report Cards
6. Part 6 - Five step program for environmental report cards
7. Part 7 - Oh Canada!
8. Part 8 - Communicating Science Effectively poster
About the author
Bill Dennison

Dr. Bill Dennison is a Professor of Marine Science and Vice President for Science Application at the University of Maryland Center for Environmental Science.

