For nearly ten years the IAN symbol and image libraries have been provided completely free for any use, so long as the appropriate attribution was included. For many users this has not been a problem - all that was required was a short credit to IAN and a link to our website.
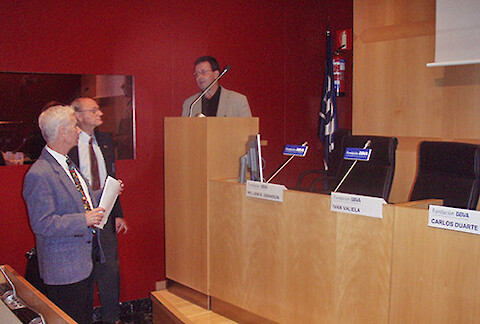
Today I learned of the untimely death of my colleague Scott Nixon from the University of Rhode Island Graduate School of Oceanography. There will be eloquent eulogies in the ensuing weeks and months, as Scott had a profound impact on many students and colleagues. While I will leave the eulogies to those former students and colleagues who knew Scott well, I did have a wonderful experience with Scott in October 2007 in Madrid, Spain that I am reflecting on.
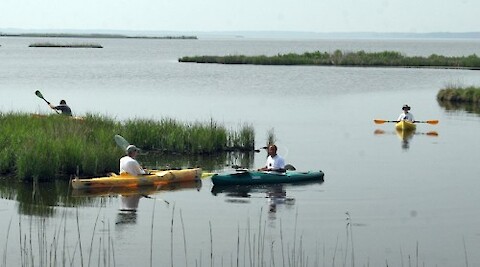
Organized by 350.org, the global climate action day Connect the Dots event at Blackwater National Wildlife Refuge on Sat May 5 was a great success. In advance of the event on May 4, we had a little local press coverage - Maryland Daily Record and Baltimore Sun - via a telephone conference call arranged by Mike Tidwell of the Chesapeake Climate Action Network. This was my statement:
350.org, as part of their movement to solve the climate crisis, has declared May 5 to be Climate Impacts Day. They have a network of people in 188 countries who are concerned about the effects of climate change and the lack of action, globally and locally. May 5 is the day they are rallying this network to create a global day of action by holding "Connect the Dots" events all over the world.
The Integration and Application Network's symbol libraries have been developed over many years by various science communicators. In our attempts to build a global symbol language, we also welcome high quality contributions from anyone with relevant, high quality vector illustrations.
QUESTION: Hi, Adam from the Department of Environment. Thanks for the presentation. One of the key messages I got which was really cool was that you think that it’s important to synthesize as you go through the research. I want to know the challenges in terms of synthesizing and sharing knowledge and data before publishing. What are the pros and cons? How do you balance that juxtaposition? BILL: Very good question.
One of the things I would like to leave this conference with is some ideas about how we can collaborate between Chesapeake Bay and Australia. Let’s figure out how we can collaborate and work together. I’ll give you an example that I’ve thought up with some other folks at the University of Queensland. We can look at event-driven responses. We had a big flood in 2003 in the Chesapeake, and of course, Moreton Bay had the 2011 flood.
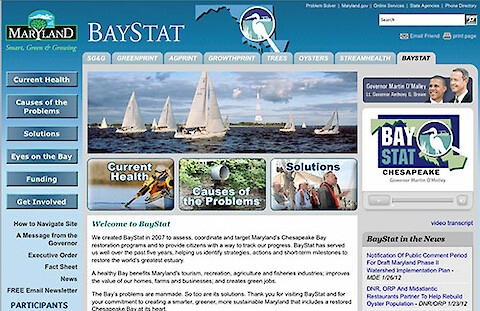
This is where Governor O’Malley came in and he created BayStat. This was based on tracking nutrient and sediment reductions. Our eutrophication problem is over-enrichment of nutrients creating dissolved oxygen “dead zones”. Innovations in governance: BayStat … O'Malley puts together an interesting assortment of people.
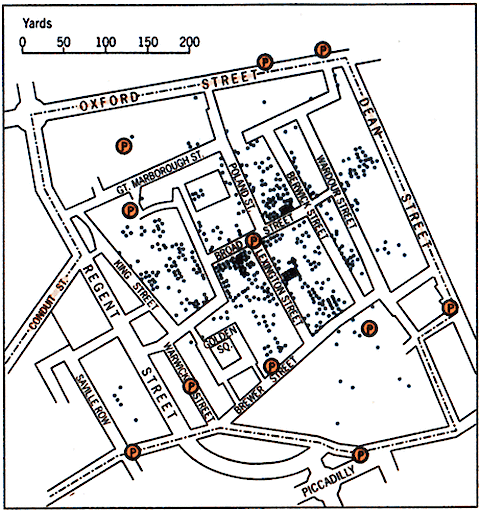
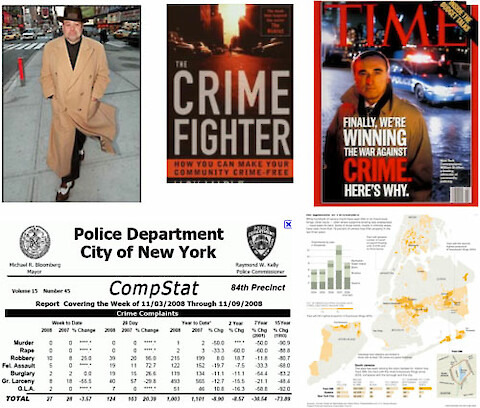
The last thing I want to talk about is innovations in governance. This is a story I want to start in New York City, where there was a guy called Jack Maple. He always had a bow-tie and a bowler. He was a transit cop, policing the subways and buses in New York. He started putting pins on maps, to plot where crime was. He then started being seen as some guru, because he predicted Friday at 4 o clock, there was going to be a mugging at the Broadway Street subway station.
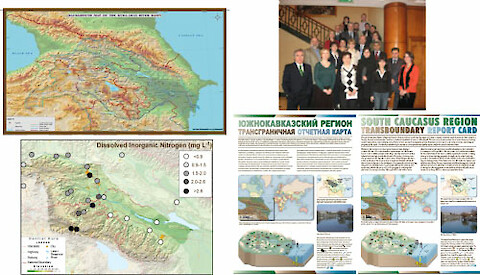
Report cards are also a great way to bring together disparate groups. An extreme example is that the US State Department was trying to mediate some dialog between Armenia, Georgia and Azerbaijan when Armenia and Azerbaijan were technically still at war. So we got together with them, and we put up this first map of six indicators. They had never seen this map or this data before.