Sara Morales and Vanessa Vargas-Nguyen … As we are approaching the end of our report card course, our last week’s class focused on the final phase of the report card process - Raising the grade! The report card is a great tool to communicate the status of ecosystem health and help raise awareness but it is lacking in providing recommendations that can help stakeholders improve ecosystem health.
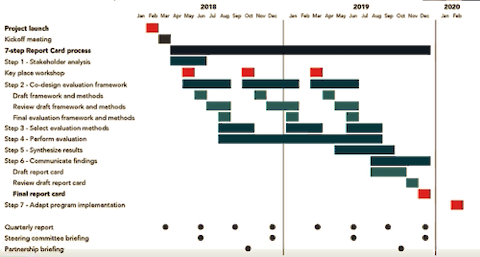
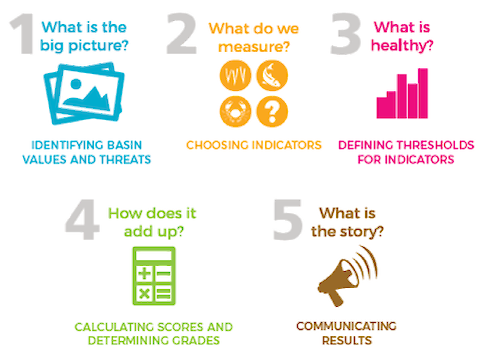
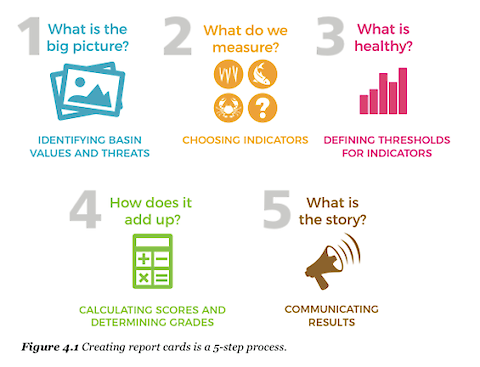
César Vázquez Gonzáles and Ricardo Merlos Riestra … During last week's class we saw two paramount videos for the course, and both were poured with several information. On the first lecture, Dr. Heath Kelsey talked shortly about how to make the five steps of the report card (RC) happen. It’s important to remember that planning goes beyond just the activities considered, so scoping the project, staffing and setting a timeline are some of these things.
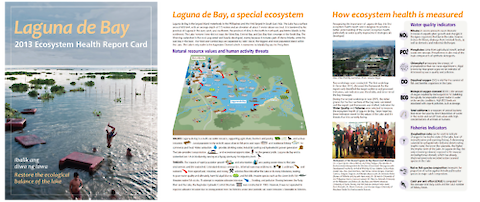
Kawawa Banda and Chinyawezhi Kakoma … Report cards are effective communications tools. They raise awareness of a river basin, explain the current health and challenges in a way everyone can understand, and create a public foundation to drive and track change. This week, our class on “Developing an Ecosystem Health Report Card” continued with step 5 of the report card process - “What is the story?
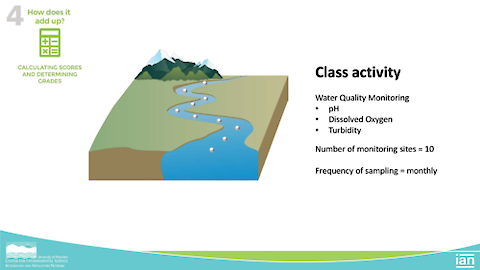
Siuling Cinco Castro and Javier Ramirez Ramirez … We have thresholds and so, what is the next step? Yes, calculating scores and determining grades! Our class this week on "Developing an Ecosystem Health Report Card" continued with Step 4 of the report card process - "How does it add up? Calculating the scores and determining the grades". The class began with Dr. Heath Kelsey answering all the questions related with the lectures on calculating scores and determining grades.
Agness Sililo Musutu and Andrea Rivera-Sosa … (aka the "A" team) The fourth class of our Developing an Ecosystem Health Report Card course was facilitated by our guest lecturer, Dr. Simon Costanzo, who is based in Australia. Despite the huge time difference, he was kind enough to be up at midnight to teach Lecture #4, which is Step #3 of the 5-Step process of creating a report card referred to as "What is Healthy? Defining report card thresholds" (Costanzo et. al. 2017).
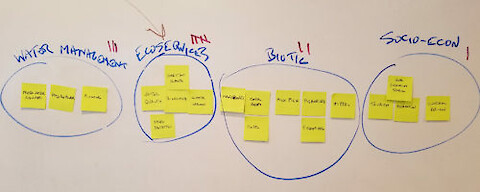
Charissa Ferrera and Namafe Namafe … After taking the first step in making the report card by looking at the bigger picture of things through conceptualization, we delved into choosing the right indicators for our reporting region. Our last class session was divided into three parts: (1) review of the major points during the previous class; (2) discussion of the assigned materials on "Step 2: What do we measure?
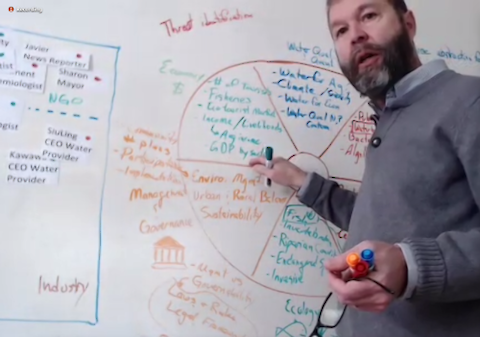
In the last class, we learned that the first step in developing a report card was to engage stakeholders to help define and visually describe the basin that could lead to a shared understanding of the current situation within a particular basin. The goals of this were the following: • Define the values within the basin that are to be protected and/or restore … • Define the threats that are causing degradation to those values or impeding their restoration.
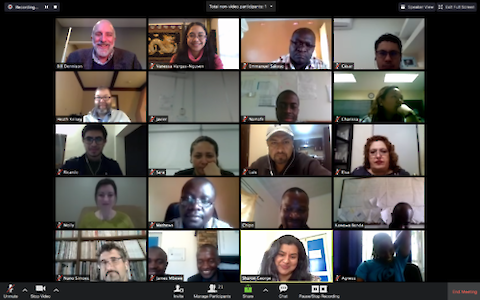
Molly Ryan and Elsa Noreña … Our "How to Make an Ecosystem Health Report Card" began this week with introductions from Dr. Bill Dennison and Dr. Heath Kelsey, our professors. They then asked that each of the participants introduce themselves and mention the place where they are from as well as the time and temperature in each of the locations.
Ximena Celis … In our last session for the IAN Healthy Rivers for All course, we reviewed and discussed the final project video presentations of all the participants. All seven presentations were great and they all reflect the understanding we gained from this useful course. Everyone said that, moving forward, they will definitely use the 5-step report card process, so good job Bill, Simon, and Heath!!!
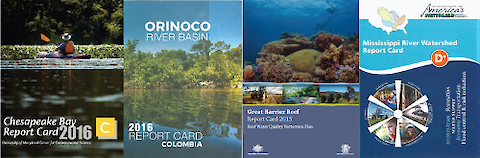
Jodie Mehrtens … In the last of the lecture series for the IAN Healthy Rivers for All course we reviewed a number of report cards targeted for external and internal assessment and communication. What really impressed me was the sheer scale of some of the report cards. They cover some serious ground! For example, the Chesapeake Bay Report Card covers a 11,601km2 with a drainage basin of 166,534 km2. The Orinoco River Basin Report Card on the Colombian portion of the 2,150km long Orinoco River.